
How-to
Empowering engineers with everything they need to build, monitor, and scale real-time data pipelines with confidence.
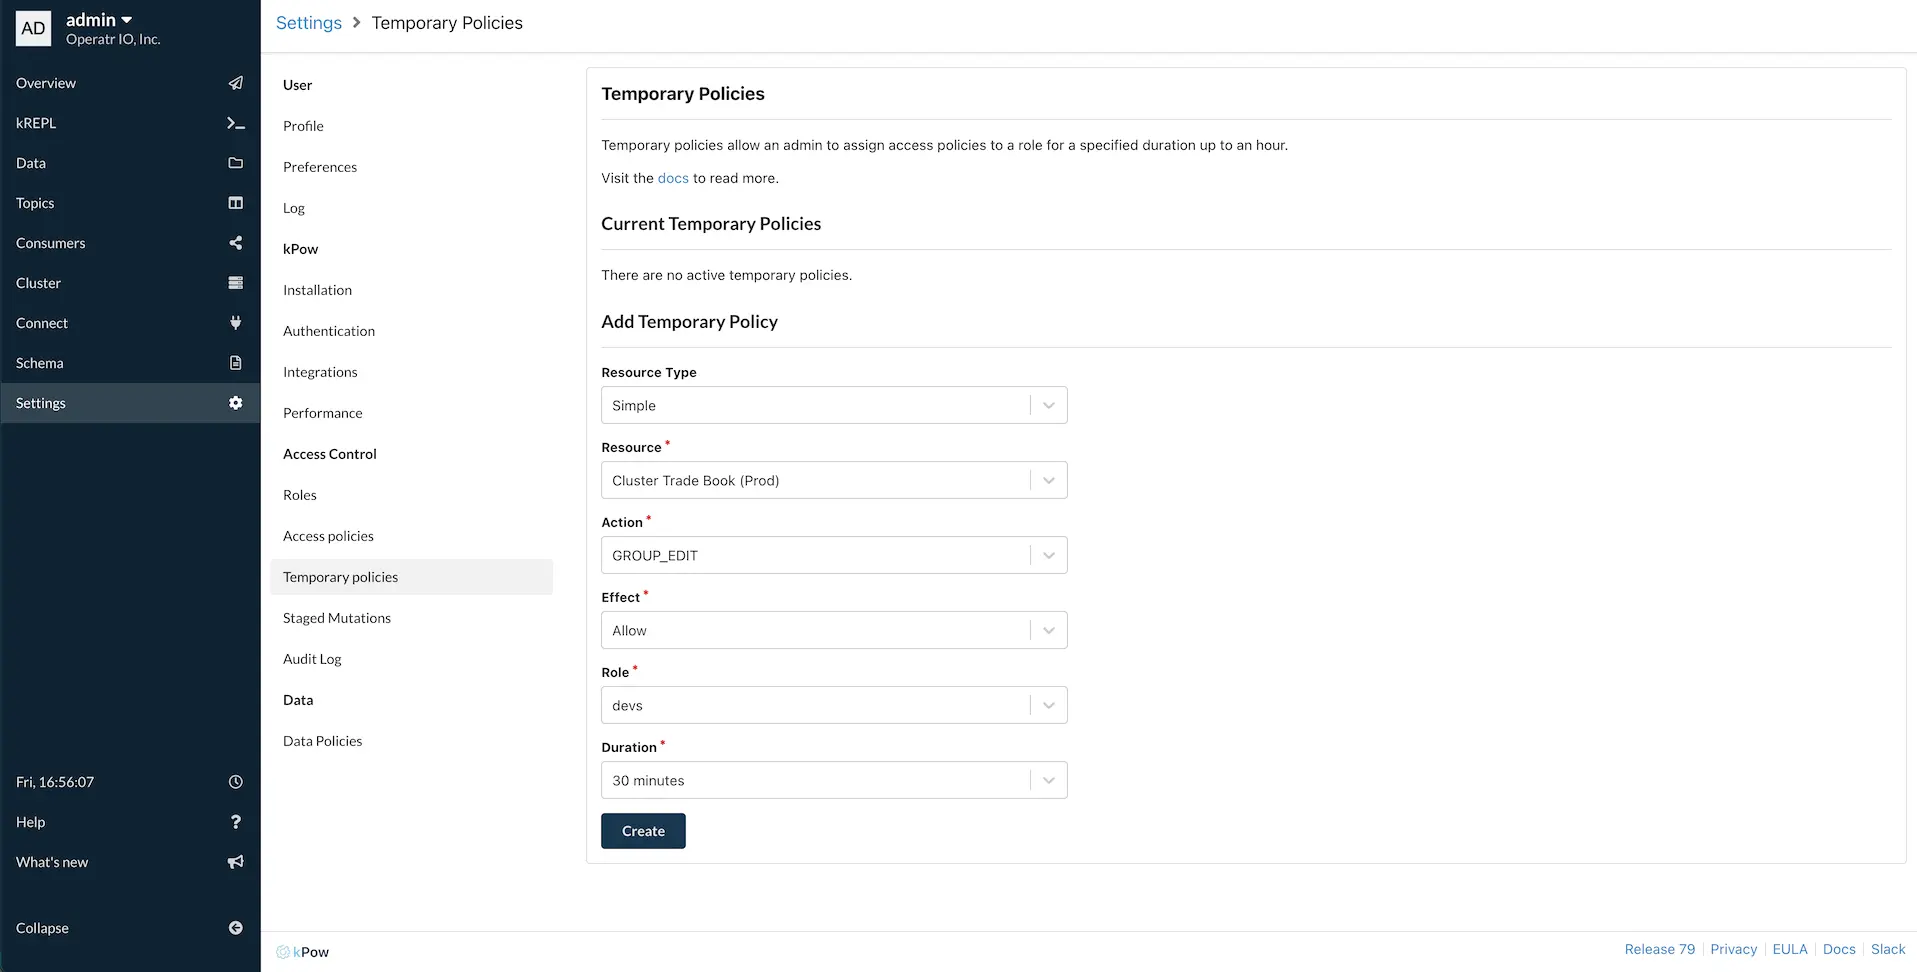
Heading 1
Heading 2
Heading 3
Heading 4
Heading 5
Heading 6
Lorem ipsum dolor sit amet, consectetur adipiscing elit, sed do eiusmod tempor incididunt ut labore et dolore magna aliqua. Ut enim ad minim veniam, quis nostrud exercitation ullamco laboris nisi ut aliquip ex ea commodo consequat. Duis aute irure dolor in reprehenderit in voluptate velit esse cillum dolore eu fugiat nulla pariatur.
Block quote
Ordered list
- Item 1
- Item 2
- Item 3
Unordered list
- Item A
- Item B
- Item C
Bold text
Emphasis
Superscript
Subscript
Run Kpow in Kubernetes with Helm
This article covers running Kpow in Kubernetes using the Kpow Helm Chart. Introduction Kpow is the all-in-one toolkit to manage, monitor, and learn about your Kafka resources. Helm is the package manager for Kubernetes. Helm deploys charts, which you can think of as a packaged application. We publish...
This article covers running Kpow in Kubernetes using the Kpow Helm Chart.
Update 24-01-2023: The process for installing Kpow with Helm has changed since this article was originally published.
You are advised to follow the instructions described in the Kpow Helm Charts Readme on Github.
The article is left intact below for archive purposes only.
Introduction
Kpow is the all-in-one toolkit to manage, monitor, and learn about your Kafka resources.
Helm is the package manager for Kubernetes. Helm deploys charts, which you can think of as a packaged application.
We publish a Helm chart for Kpow in our Helm Chart Repository. You can view the details of both in ArtifactHUB.
Prerequisites
Before we can install Kpow we need to obtain a trial license, configure our local environment, and connect to Kubernetes.
Get a License
You require a license to run Kpow, sign-up for a free 30-day trial today.
See Kpow on the AWS Marketplace to have Kpow billed automatically to your AWS account, no license required.
Configure Your Environment Environment
You will need to install:
Connect to Kubernetes
Installing Kpow with Helm requires a Kubernetes environment, in this quick-start guide we use Amazon EKS.
Update your EKS Cluster Configuration
Use the AWS CLI to update your current EKS cluster configuration.
aws eks --region <your-aws-region> update-kubeconfig --name <your-eks-cluster-name>
Updated context arn:aws:eks:<your-aws-region>:123123123:cluster/<your-eks-cluster-name> in /your/.kube/configConfirm EKS Cluster Availability
Use kubectl to check the availability of your configured EKS cluster.
kubectl get svc
NAME TYPE CLUSTER-IP EXTERNAL-IP PORT(S) AGE
kubernetes ClusterIP 12.345.6.7 <none> 443/TCP 28hNow that we're configured and connected, we're ready to install Kpow!
Install Kpow with Helm
Kpow can be installed in Kubernetes with Helm in these simple steps.
Configure the Kpow Helm Repository
Register the Kpow Helm repository, then update your Helm repo configuration to make sure you install the latest version of Kpow.
helm repo add kpow https://charts.kpow.io && \
helm repo updateGet the Kpow Helm Chart
We pull the Kpow Helm chart to a local directory so that we can make configuration changes before installing Kpow.
helm pull kpow/kpow --untar --untardir .Update Kpow Configuration
The minimum information required by Kpow to operate is:
- License Details (sign-up for a free 30-day trial today)
- Kafka Bootstrap URL
Kpow is configured by a ConfigMap containing all of the Environment Variables described in our documentation.
Edit the ConfigMap and make the changes required for your environment.
vi ./kpow/templates/kpow-config.yamlStart Kpow
You are now ready to launch a Kpow instance, in this example we will create and launch in the operatr-io namespace.
helm install --namespace operatr-io --create-namespace my-kpow ./kpow Access the Kpow UI
Now that your instance is running, you can access the UI by running the commands included in the output of the previous command.
export POD_NAME=$(kubectl get pods --namespace operatr-io -l "app.kubernetes.io/name=kpow,app.kubernetes.io/instance=my-kpow" -o jsonpath="{.items[0].metadata.name}")
echo "Visit http://127.0.0.1:3000 to use your application"
kubectl --namespace operatr-io port-forward $POD_NAME 3000:3000The Kpow UI is now available on http://127.0.0.1:3000.
Manage the Kpow Instance
If you encounter errors installing Kpow or accessing the Kpow UI you can view the installed pods and their logs.
View the Kpow Pod
Use kubectl to list pods in the operatr-io namespace.
kubectl describe pods --namespace operatr-ioView the Kpow Pod Logs
Using the name of the pod from the previous command output, use kubectl to view the pod logs
kubectl logs --namespace operatr-io my-kpow-9988df6b6-vvf8z Delete Kpow
Removing the Kpow instance is simple with Helm.
helm delete --namespace operatr-io my-kpowNext Steps
- If you have any issues or would like to walk through your Kubernetes use cases with us, contact support@factorhouse.io.
- Visit https://docs.kpow.io for the full list of configuration options and Kpow features available to you.
- Check out our AWS Marketplace guide for details of running Kpow in EKS billed automatically to your AWS account.
Heading 1
Heading 2
Heading 3
Heading 4
Heading 5
Heading 6
Lorem ipsum dolor sit amet, consectetur adipiscing elit, sed do eiusmod tempor incididunt ut labore et dolore magna aliqua. Ut enim ad minim veniam, quis nostrud exercitation ullamco laboris nisi ut aliquip ex ea commodo consequat. Duis aute irure dolor in reprehenderit in voluptate velit esse cillum dolore eu fugiat nulla pariatur.
Block quote
Ordered list
- Item 1
- Item 2
- Item 3
Unordered list
- Item A
- Item B
- Item C
Bold text
Emphasis
Superscript
Subscript

Kafka Alerting with Kpow, Prometheus and Alertmanager
This article covers setting up alerting with Kpow using Prometheus and Alertmanager. Introduction Kpow was built from our own need to monitor Kafka clusters and related resources (eg, Streams, Connect and Schema Registries). Through Kpow's user interface we can detect and even predict potential problems...
This article covers setting up alerting with Kpow using Prometheus and Alertmanager.
Introduction
Kpow was built from our own need to monitor Kafka clusters and related resources (eg, Streams, Connect and Schema Registries).
Through Kpow's user interface we can detect and even predict potential problems with Kafka such as:
- Replicas that have gone out of sync
- Consumer group assignments that are lagging above a certain threshold
- Topic growth that will exceed a quota
How can we alert teams as soon as these problems occur?
Kpow does not provide its own alerting functionality but instead integrates with Prometheus for a modern alerting solution.
Why don't we natively support alerting?
We believe a dedicated product like Prometheus is better suited for alerting rather than an individual product in most cases. Most organizations have alerting needs beyond Kafka, and having alerting managed from a centralized service, such as Prometheus makes more sense.
Don't use Prometheus?
Fear not, almost every major observability tool on the market today supports Prometheus metrics. For example, Grafana Cloud supports Prometheus alerts out of the box.
This article will demonstrate how to set up Kpow with Prometheus + AlertManager, alongside example configuration to help you start defining your alerts when things go wrong with your Kafka cluster.
Architecture
Here is the basic architecture of alerting with Prometheus:

Alerts are defined in Prometheus configuration. Prometheus pulls metrics from all client applications (including Kpow). If any condition is met, Prometheus pushes the alert to the AlertManager service, which manages the alerts through its pipeline of silencing, inhibition, grouping and sending out notifications. Essentially what that means is that AlertManager takes care of deduplicating, grouping and routing of alerts to the correct integration such as Slack, email or Opsgenie.
Kpow Metrics
The unique thing about Kpow as a product is that we calculate our own telemetry about your Kafka Cluster and related resources.
This has a ton of advantages:
- No dependency on Kafka's own JMX metrics - This allows frictionless installation and configuration.
- From our observations of your Kafka cluster we calculate a wide range of Kafka metrics, including group and topic offset deltas.
- This same pattern applies to other supported resources such as Kafka Connect, Kafka Streams and Schema Registry metrics.
Environment Setup
We provide a docker-compose.yml configuration that starts up Kpow, a 3-node Kafka cluster and Prometheus + AlertManager. This can be found in the kpow-local repositry on GitHub. Instructions on how to start a 30-day trial can be found in the repository if you are new to Kpow.
git clone https://github.com/factorhouse/kpow-local.gitcd kpow-localvi local.env # add your LICENSE details, see kpow-local README.mddocker-compose up
Once the Docker Compose environment is running:
- Alertmanager's web UI will be reachable on port
9001 - Prometheus' web UI will be reachable on port
9090 - Kpow's web UI will be reachable on port
3000
The remainder of this tutorial will be based off the Docker Compose environment.
Prometheus Configuration
A single instance of Kpow can observe and monitor multiple Kafka clusters and related resources! This makes Kpow a great aggregator for your entire Kafka deployment across multiple environments as a single Prometheus endpoint served by Kpow can provide metrics about all your Kafka resources.
When Kpow starts up, it logs the various Prometheus endpoints available:
--* Prometheus Egress: * GET /metrics/v1 - All metrics * GET /offsets/v1 - All topic offsets * GET /offsets/v1/topic/[topic-name] - All topic offsets for specific topic, all clusters. * GET /streams/v1 - All Kafka Streams metrics * GET /streams/v1/group/[group-name] - All Kafka Streams metrics for specific group, all clusters * GET /metrics/v1/cluster/sb2i_wfxSa-LaD0srBaMiA - Metrics for cluster Dev01 * GET /offsets/v1/cluster/sb2i_wfxSa-LaD0srBaMiA - Offsets for cluster Dev01 * GET /streams/v1/cluster/sb2i_wfxSa-LaD0srBaMiA - Kafka Streams metrics for cluster Dev01 * GET /metrics/v1/connect/sb2i_wfxSa-LaD0srBaMiA - Metrics for connect instance sb2i_wfxSa-LaD0srBaMiA (cluster sb2i_wfxSa-LaD0srBaMiA) * GET /metrics/v1/cluster/lkc-jyojm - Metrics for cluster Uat01 * GET /offsets/v1/cluster/lkc-jyojm - Offsets for cluster Uat01 * GET /streams/v1/cluster/lkc-jyojm - Kafka Streams metrics for cluster Uat01 * GET /metrics/v1/schema/a2f06a916672d71d675f - Metrics for schema registry instance a2f06a916672d71d675f (cluster lkc-jyojm) * GET /metrics/v1/cluster/CuxsifYVRhSRX6iLTbANWQ - Metrics for cluster Prod1 * GET /offsets/v1/cluster/CuxsifYVRhSRX6iLTbANWQ - Offsets for cluster Prod1 * GET /streams/v1/cluster/CuxsifYVRhSRX6iLTbANWQ - Kafka Streams metrics for cluster Prod1
This allows Prometheus to only consume a subset of metrics (eg, metrics about a specific consumer group or resource).
To have Prometheus pull all metrics, add this entry to your scrape_configs:
scrape_configs: - job_name: 'kpow' metrics_path: '/metrics/v1' static_configs: - targets: ['http://kpow:3000']
Note : you will need to provide a reachable target. In this example Kpow is reachable at http://kpow:3000.
Within your prometheus config, you will need to specify a location to your rules.yml file:
rule_files: - kpow-rules.yml
Our kpow-rules.yml file looks something like:
groups:- name: Kafka rules: # Example rules in section below
We have a single alert group called Kafka. The collection of rules are explained in the next section.
The sample kpow-rules.yml and alertmanager.yml config can be found here. In this example alertmanager will be sending all fired alerts to a Slack WebHook.
Kpow Metric Structure
A glossary of available Prometheus metrics from Kpow can be found here.
All Kpow metrics follow a similar labelling convention:
domain- the category of metric (for examplecluster,connect,streams)id- the unique identifier of the category (for example Kafka Cluster ID)target- the identifier of the metric (for example consumer group, topic name etc)env- an optional label to identify thedomain
For example, the metric:
group_state{domain="cluster",id="6Qw4099nSuuILkCkWC_aNw",target="tx_partner_group4",env="Trade_Book__Staging_",} 4.0 1619060220000
Relates to a Kafka Cluster (with id 6Qw4099nSuuILkCkWC_aNw and label Trade Book Staging) for consumer group tx_partner_group4.
Prometheus Rules
The remainder of this section will provide example Prometheus rules for common alerting scenarios.
Alerting when a Consumer Group is unhealthy
- alert: UnhealthyConsumer expr: group_state == 0 or group_state == 1 or group_state == 2 for: 5m annotations: summary: "Consumer {{ $labels.target }} is unhealthy" description: "The Consumer Group {{ $labels.target }} has gone into {{ $labels.state }} for cluster {{ $labels.id }}"
Here, the group_state metric from Kpow is exposed as a gauge and the value represents the ordinal value of the ConsumerGroupState enum. The expr is testing whether group_state enters state DEAD, EMPTY or UNKNOWN for all consumer groups.
The for clause causes Prometheus to wait for a certain duration between first encountering a new expression output vector element and counting an alert as firing for this element. In this case 5 minutes.
The annotations section then provides a human readable alert description which describes which consumer group has entered an unhealthy state. Group state has a state label that contains the human-readable value of the state (eg, STABLE).
Alerting when a Kafka Connect task is unhealthy
Similar to our consumer group configuration, we can alert when we detect a connector task has gone into an ERROR state.
- alert: UnhealthyConnectorTask expr: connect_connector_task_state != 1 for: 5m annotations: summary: "Connect task {{ $labels.target }} is unhealthy" description: "The Connector task {{ $labels.target }} has gone into {{ $labels.target }} for cluster {{ $labels.id }}"- alert: UnhealthyConnector expr: connect_connector_state != 1 for: 5m annotations: summary: "Connector {{ $labels.target }} is unhealthy" description: "The Connector {{ $labels.target }} has gone into {{ $labels.target }} for cluster {{ $labels.id }}"
Here we have configured two alerts: one if an individual connector task goes enters an error state, and one if the connector itself enters an error state. The value of 1 represents the RUNNING state.
Alerting when a consumer group is lagging above a threshold
In this example Prometheus will fire an alert if any consumer groups lag exceeds 5000 messages for more than 5 minutes.
We can configure a similar alert for host_offset_lag to monitor individual lagging hosts, or even broker_offset_lag for lagging behind brokers.
- alert: LaggingConsumerGroup expr: group_offset_lag > 5000 for: 5m annotations: summary: "Consumer group {{ $labels.target }} is lagging" description: "Consumer group {{ $labels.target }} is lagging for cluster {{ $labels.id }}"
Alerting when the Kpow instance is down
- alert: KpowDown expr: up == 0 and {job="kpow"} for: 1m annotations: summary: "Kpow is down" description: "Kpow instance {{ $labels.target }} has been down for more than 1 minute."
Conclusion
This article demonstrates how you can build out a modern alerting system with Kpow and Prometheus.
Source code for configuration, including a demo docker-compose.yml of the setup can be found here.
Prometheus metrics are the de-facto industry standard, meaning similar integrations are possible with services such as Grafana Cloud or New Relic. All of these services provide an equally compelling solution to alerting.
What's even more exciting for us is Amazon's Managed Service for Prometheus which is currently in feature preview. This service looks to make Prometheus monitoring of containerized applications at scale much easier.
While Prometheus metrics are what we expose for data egress with Kpow, please get in touch if you would like alternative metric egress formats in Kpow such as WebHooks or even a JMX connection - we'd love to know your use case!
Further reading/references
- Step-by-step guide to setting up Prometheus Alertmanager with Slack, PagerDuty, and Gmail
- Prometheus Alerting with AlertManager
Manage, Monitor and Learn Apache Kafka with Kpow by Factor House.
We know how easy Apache Kafka® can be with the right tools. We built Kpow to make the developer experience with Kafka simple and enjoyable, and to save businesses time and money while growing their Kafka expertise. A single Docker container or JAR file that installs in minutes, Kpow's unique Kafka UI gives you instant visibility of your clusters and immediate access to your data.
Kpow is compatible with Apache Kafka+1.0, Red Hat AMQ Streams, Amazon MSK, Instaclustr, Aiven, Vectorized, Azure Event Hubs, Confluent Platform, and Confluent Cloud.
Start with a free 30-day trial and solve your Kafka issues within minutes.
Join the Factor Community
We’re building more than products, we’re building a community. Whether you're getting started or pushing the limits of what's possible with Kafka and Flink, we invite you to connect, share, and learn with others.