Read More

Developer
Knowledge Center
Empowering engineers with everything they need to build, monitor, and scale real-time data pipelines with confidence.


Release 95.3: Memory leak fix for in-memory compute users
95.3 fixes a memory leak in our in-memory compute implementation, reported by our customers.
Read More
Highlights
Release
January 19, 2026
Release 95.3: Memory leak fix for in-memory compute users
95.3 fixes a memory leak in our in-memory compute implementation, reported by our customers.
Release
January 12, 2026
Release 95.2: quality-of-life improvements across Kpow, Flex & Helm deployments
95.2 focuses on refinement and operability, with improvements across the UI, consumer group workflows, and deployment configuration. Alongside bug fixes and usability improvements, this release adds new Helm options for configuring the API and controlling service account credential automounting.
How-to
December 8, 2025
Integrate Kpow with Oracle Compute Infrastructure (OCI) Streaming with Apache Kafka
Unlock the full potential of your dedicated OCI Streaming with Apache Kafka cluster. This guide shows you how to integrate Kpow with your OCI brokers and self-hosted Kafka Connect and Schema Registry, unifying them into a single, developer-ready toolkit for complete visibility and control over your entire Kafka ecosystem.
All Resources
Thank you! Your submission has been received!
Oops! Something went wrong while submitting the form.
How-to
July 7, 2021
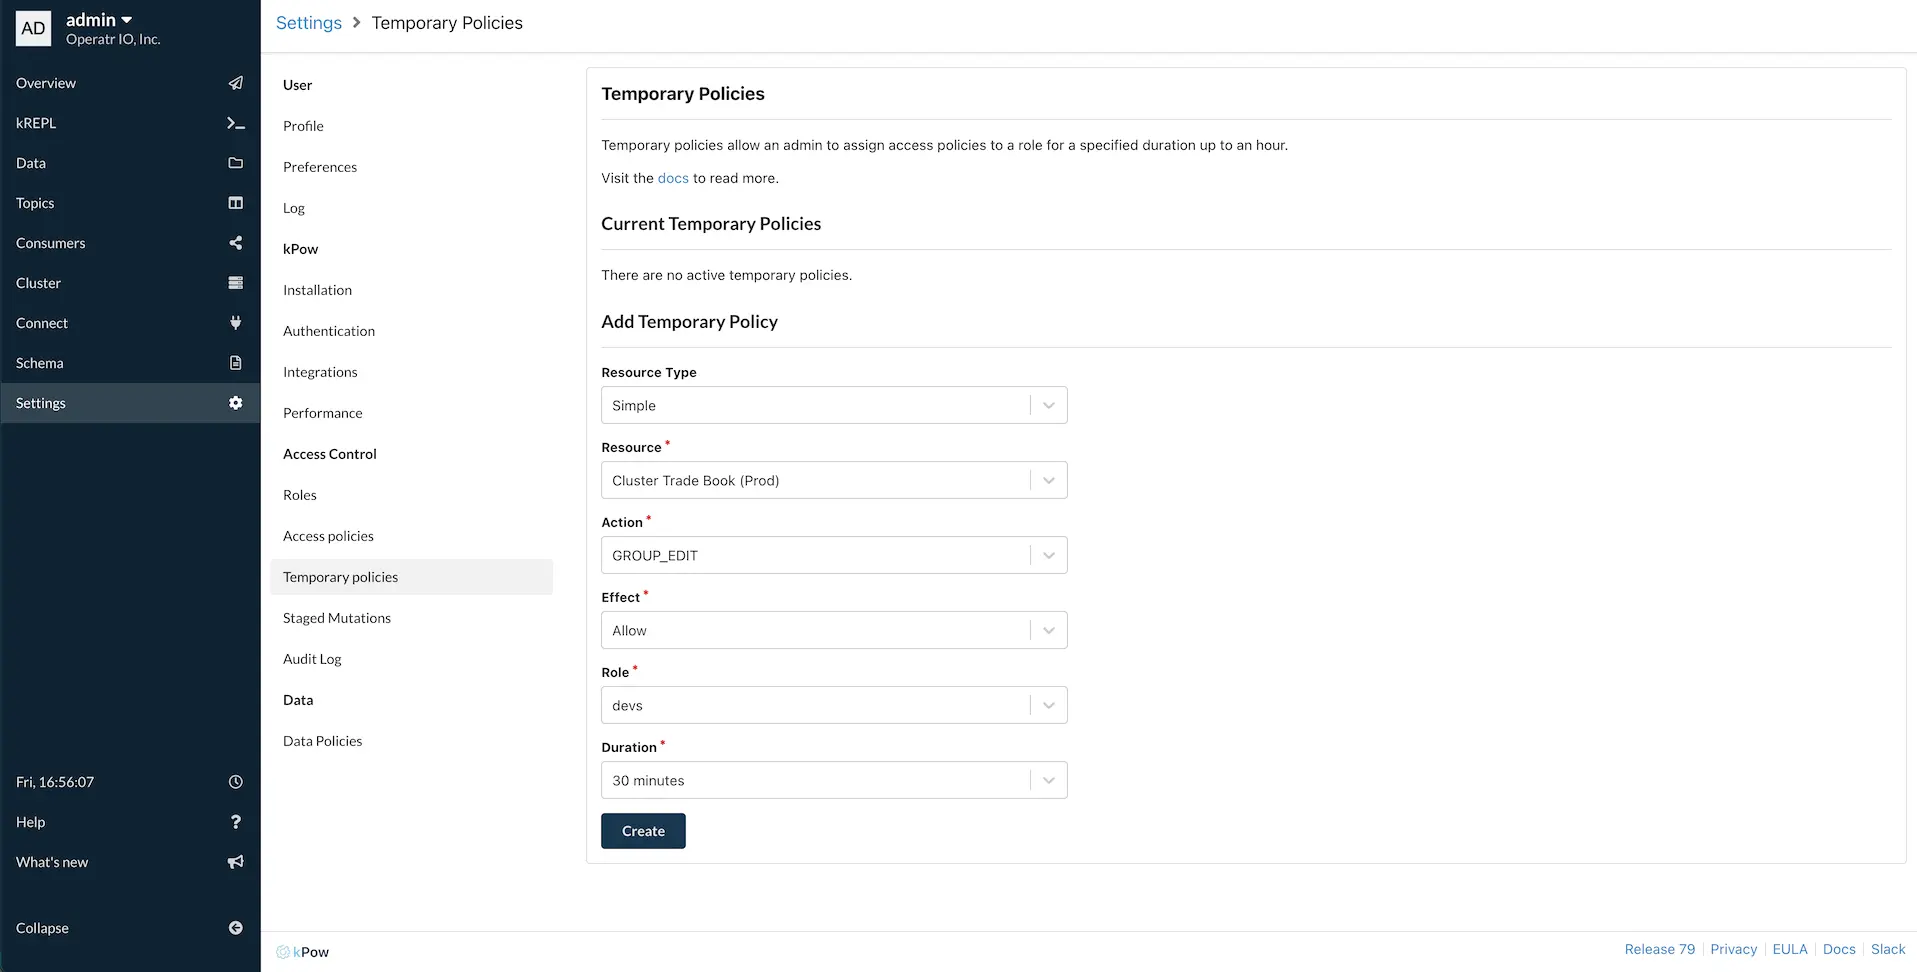
Manage Temporary Access to Kafka Resources
Temporary policies allow Admins the ability to assign access control policies for a fixed duration. This blog post introduces temporary policies with an all-to-common real-world scenario.
How-to
June 30, 2021
Deploy Clojure Projects to Maven Central with Leiningen
This article provides a step-by-step guide to how we deploy the Kpow Kafka Streams Monitoring Agent to Maven Central with Leiningen.
Release
June 25, 2021
Release 79: Kpow Admin – Staged Mutations and Temporary Policies
Kpow v79 introduces Kpow Admin roles with the ability to Stage Mutations and create Temporary RBAC Policies, all wrapped up in a new Settings UI.
Release
June 7, 2021
Release 78: Multi-Topic Search and UI Refresh
Kpow v78 provides a major overhaul of our user interface and the brand new ability to search multiple topics at the same time in Data Inspect.
How-to
June 1, 2021
Run Kpow in Kubernetes with Helm
This article covers running Kpow in Kubernetes using the Kpow Helm Chart. Introduction Kpow is the all-in-one toolkit to manage, monitor, and learn about your Kafka resources. Helm is the package manager for Kubernetes. Helm deploys charts, which you can think of as a packaged application. We publish...

How-to
May 24, 2021
Kafka Alerting with Kpow, Prometheus and Alertmanager
This article covers setting up alerting with Kpow using Prometheus and Alertmanager. Introduction Kpow was built from our own need to monitor Kafka clusters and related resources (eg, Streams, Connect and Schema Registries). Through Kpow's user interface we can detect and even predict potential problems...
Events & Webinars
Stay plugged in with the Factor House team and our community.

Event
18 February 2026
Sydney Workshop: Building Resilient Event-Driven Systems with Kafka and Flink
We're teaming up with NetApp Instaclustr and Ververica to run this intensive half-day workshop where you'll design, build, and operate a complete real-time operational system from the ground up.

Event
19 February 2026
Melbourne Workshop: Building Resilient Event-Driven Systems with Kafka and Flink
We're teaming up with NetApp Instaclustr and Ververica to run this intensive half-day workshop where you'll design, build, and operate a complete real-time operational system from the ground up.
Join the Factor Community
We’re building more than products, we’re building a community. Whether you're getting started or pushing the limits of what's possible with Kafka and Flink, we invite you to connect, share, and learn with others.


