Change Data Capture (CDC) tracks row-level changes in a database and publishes them as events. When paired with Apache Kafka, CDC turns your databases into real-time event streams without modifying application code or adding polling overhead.
This guide covers CDC fundamentals, compares the dominant implementation patterns, walks through a working PostgreSQL-to-Kafka setup, and shows where CDC fits in a broader data mesh architecture.
Key takeaways
- CDC captures row-level changes from databases and streams them as events to Kafka, eliminating the latency and resource waste of traditional batch ETL.
- Log-based CDC reads the database transaction log directly, capturing all changes including deletes by reading the log instead of polling tables, though snapshots and connector load still affect the source database.
- Debezium and Kafka Connect JDBC are the two main CDC patterns for Kafka; Debezium is the preferred choice for most production use cases that require complete change capture and low latency.
- CDC fits naturally in enterprise data mesh architectures, letting domain teams publish database changes as Kafka events without modifying application code.
- Keeping CDC pipelines running reliably at scale requires operational tooling: Kpow provides real-time visibility into connector health, consumer lag, and automatic restarts across your entire Kafka environment.
What is Kafka change data capture (CDC)?
Traditional data integration relies on batch ETL: extract everything from the source, transform it, load it into the target. This approach has well-known problems. It introduces latency (hours or days), wastes resources by re-reading unchanged data, and puts load on the source database during extraction windows.
CDC solves these problems by capturing only the rows that changed (inserts, updates, deletes) and streaming them as individual events. The source database is read through its internal replication mechanism, typically the write-ahead log (WAL), so the impact on production workloads is minimal.
In practice, CDC gives you:
- Sub-second propagation of database changes to downstream systems
- A complete, ordered history of every mutation, useful for audit trails and temporal queries
- Decoupled producers and consumers, since changes flow through Kafka topics rather than direct database connections
- The ability to rebuild derived datastores by replaying the change log from a known offset
For real-time data pipelines, CDC eliminates the gap between “data at rest” and “data in motion.” Your analytical systems, search indexes, caches, and microservices all see changes as they happen rather than in delayed batches.
Kafka CDC versus ETL
CDC captures each committed row-level change from a database as it happens, while ETL extracts data from sources, transforms it with business rules, and loads it into a central repository such as a data warehouse. CDC is a capture method and ETL is a pipeline pattern, so CDC replaces the repeated full extract step of batch ETL, not ETL itself: CDC events in Kafka can act as the source of an ETL or ELT job. Teams choose CDC when downstream systems must react to inserts, updates, and deletes, and ETL when the main task is consolidating and reshaping data from many sources for analytics. Debezium keys each change event by the table’s primary key, and Apache Kafka writes events with the same key to the same partition and keeps them in order within that partition, so changes to each row arrive in commit order, but a multi-partition topic as a whole is not totally ordered. AWS describes ETL as a process that cleans and organizes raw data for storage and analytics, run periodically or even at runtime.
| Aspect | Kafka CDC | ETL |
|---|---|---|
| Unit of work | One row-level change (insert, update, or delete) | A dataset extracted from one or more sources |
| Timing | Continuous, in commit order per row key (within a partition) | Scheduled batches or on demand |
| Transformation | Events carry before and after row state; consumers or stream processors transform downstream | Business rules clean and reshape data before loading |
| Deletes | Captured as delete events | Depends on how the pipeline is built |
| Source database load | Reads the transaction log; snapshots and connector load still apply | Depends on the extraction method |
| Typical target | Kafka topics feeding caches, search indexes, derived views, and other data stores | A data warehouse or other central repository |
Log-based versus query-based CDC for Kafka
There are two fundamental approaches to capturing changes from a database.
Log-based CDC reads the database’s internal transaction log (WAL in PostgreSQL, binlog in MySQL, redo log in Oracle). This is the preferred method. The database already writes these logs for crash recovery and replication, so CDC reads them instead of running polling queries against the tables. A connector can still add some load to the source database, and initial snapshots add more. Log-based CDC captures all changes including deletes, preserves the exact ordering of transactions, and works without schema modifications.
Query-based CDC periodically polls the source table using SQL queries, typically filtering by a last_modified timestamp column. This is simpler to set up but has significant limitations: it cannot reliably detect deletes, requires a timestamp or incrementing column on every tracked table, misses rapid intermediate changes between polls, and puts read load on the source database.
For most production use cases, log-based CDC is the correct choice. Query-based CDC can work for simple, append-only tables where deletes are not a concern.
Choosing a Kafka CDC connector
The two most common ways to implement CDC with Kafka are Debezium (log-based) and the Kafka Connect JDBC Source Connector (query-based). They serve different purposes.
Debezium CDC for Kafka
Debezium is an open-source CDC platform built on Kafka Connect. It reads database transaction logs directly and produces change events to Kafka topics.
Key characteristics:
- Reads WAL/binlog/redo logs directly; no schema changes required on source tables
- Captures inserts, updates, and deletes with full before/after images of each row
- Provides at-least-once delivery by default, with exactly-once support in specific cases through Kafka Connect’s exactly-once source support
- Supports PostgreSQL, MySQL, MongoDB, SQL Server, Oracle, Db2, and others
- Emits a structured envelope containing the operation type, before state, after state, source metadata, and transaction info
- Handles initial snapshots of existing data before switching to log streaming
Kafka Connect JDBC
The JDBC Source Connector uses SQL queries to poll for changes at a configured interval.
Key characteristics:
- Requires a
timestampcolumn, anincrementingcolumn, or both to detect changes - Cannot capture deletes (the row is gone before the next poll)
- Simpler setup: no database-level replication configuration needed
- Higher latency, bounded by the poll interval
- Puts periodic query load on the source database
- Works with any JDBC-compatible database
Product demo · 2 min
Kafka Connect monitoring and tasks: Kpow demo
Chad Harris walks through Kafka Connect in Kpow: connector and task state at a glance, historical health charts, deploying connectors from the UI, and bulk-restarting a subset of tasks.
Debezium versus Kafka Connect JDBC
Use Debezium when you need complete change capture (including deletes), low latency, minimal source database impact, and accurate ordering of changes. This covers most CDC use cases.
Use the JDBC Source Connector when you have a simple append-only or update-only table, cannot configure database-level replication permissions, or need a quick prototype before investing in log-based CDC infrastructure.
Working Example: PostgreSQL to Kafka with Debezium
The following walks through a complete setup using PostgreSQL’s logical replication and Debezium.
Step 1: Configure PostgreSQL for Logical Replication
Edit postgresql.conf:
wal_level = logical
max_replication_slots = 4
max_wal_senders = 4
Create a replication user and grant permissions:
CREATE ROLE debezium WITH REPLICATION LOGIN PASSWORD 'dbz_password';
GRANT USAGE ON SCHEMA public TO debezium;
GRANT SELECT ON ALL TABLES IN SCHEMA public TO debezium;
ALTER DEFAULT PRIVILEGES IN SCHEMA public GRANT SELECT ON TABLES TO debezium;
Create a publication for the tables you want to track:
CREATE PUBLICATION dbz_publication FOR TABLE orders, customers, products;Step 2: Deploy Kafka Connect with Debezium
A docker-compose.yml snippet for the Kafka Connect worker with the Debezium PostgreSQL connector plugin:
kafka-connect:
  image: debezium/connect:2.5
  ports:
    - "8083:8083"
  environment:
    BOOTSTRAP_SERVERS: kafka:9092
    GROUP_ID: connect-cluster
    CONFIG_STORAGE_TOPIC: connect-configs
    OFFSET_STORAGE_TOPIC: connect-offsets
    STATUS_STORAGE_TOPIC: connect-status
    KEY_CONVERTER: org.apache.kafka.connect.json.JsonConverter
    VALUE_CONVERTER: org.apache.kafka.connect.json.JsonConverter
  depends_on:
    - kafka
    - postgres
Step 3: Register the Debezium Connector
Submit the connector configuration via the Kafka Connect REST API:
{
  "name": "pg-cdc-connector",
  "config": {
    "connector.class": "io.debezium.connector.postgresql.PostgresConnector",
    "database.hostname": "postgres",
    "database.port": "5432",
    "database.user": "debezium",
    "database.password": "dbz_password",
    "database.dbname": "app_db",
    "topic.prefix": "cdc",
    "schema.include.list": "public",
    "table.include.list": "public.orders,public.customers,public.products",
    "publication.name": "dbz_publication",
    "slot.name": "debezium_slot",
    "plugin.name": "pgoutput",
    "publication.autocreate.mode": "filtered",
    "snapshot.mode": "initial",
    "tombstones.on.delete": true,
    "key.converter": "org.apache.kafka.connect.json.JsonConverter",
    "value.converter": "org.apache.kafka.connect.json.JsonConverter",
    "key.converter.schemas.enable": false,
    "value.converter.schemas.enable": false
  }
}
Register it:
curl -X POST http://localhost:8083/connectors \
  -H "Content-Type: application/json" \
  -d @pg-cdc-connector.json
Step 4: Verify the Pipeline
Check the connector status:
curl -s http://localhost:8083/connectors/pg-cdc-connector/status | jq .You should see the connector and its tasks in RUNNING state. Insert a row into the source table:
INSERT INTO orders (customer_id, product_id, quantity, total)
VALUES (1, 42, 3, 149.97);
Consume from the CDC topic to see the change event:
kafka-console-consumer --bootstrap-server kafka:9092 \
  --topic cdc.public.orders \
  --from-beginning \
  --max-messages 1
The resulting event will contain an envelope with op: "c" (create), the after field with the full row state, and source metadata including the LSN (Log Sequence Number), transaction ID, and timestamp.
A Debezium change event for an insert looks like this:
{
  "before": null,
  "after": {
    "id": 1001,
    "customer_id": 1,
    "product_id": 42,
    "quantity": 3,
    "total": 149.97
  },
  "source": {
    "version": "2.5.0.Final",
    "connector": "postgresql",
    "name": "cdc",
    "ts_ms": 1704067200000,
    "db": "app_db",
    "schema": "public",
    "table": "orders",
    "lsn": 234567890,
    "txId": 5678
  },
  "op": "c",
  "ts_ms": 1704067200123
}
For updates, op is "u" and both before and after are populated. For deletes, op is "d" and after is null.
CDC events in Kafka: structure and consumption
Every change Debezium captures is published to Kafka as a structured CDC event. Understanding the shape of these events is essential for building reliable consumers.
Each CDC event in Kafka carries an envelope with four key fields:
- op indicates the operation type:
"c"for create (insert),"u"for update,"d"for delete, and"r"for a read during the initial snapshot. - before contains the full row state before the change. This is
nullfor inserts and snapshot reads. - after contains the full row state after the change. This is
nullfor deletes. - source provides metadata from the database, including the connector name, table, transaction ID, log sequence number (LSN), and commit timestamp.
Consumers that process CDC events in Kafka typically follow one of two patterns. Filter-and-apply consumers inspect the op field and route each event to the appropriate handler (insert, update, or delete logic). Event-sourcing consumers treat the full stream as an ordered log and reconstruct state by replaying events from a known offset, making it straightforward to rebuild derived data stores after failures or schema migrations.
When publishing CDC events to Kafka, topic naming conventions matter for downstream discoverability. A common pattern is {prefix}.{schema}.{table}, such as cdc.public.orders. This makes it easy for consumers to subscribe to specific tables and for schema registry tooling to apply per-topic compatibility rules.
Kafka CDC in an enterprise data mesh architecture
In a data mesh, domain teams own their data products and expose them through well-defined interfaces. CDC fits naturally into this model because it allows teams to publish their database changes as domain events without building custom event-producing application code.
A typical architecture looks like this:
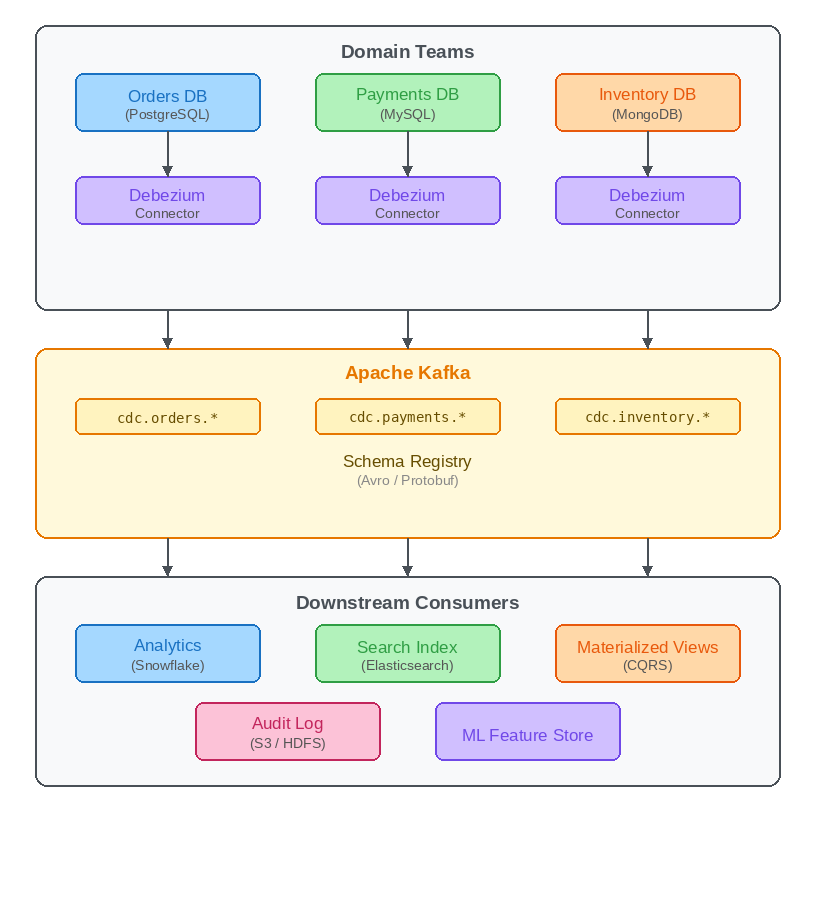
Each domain team runs a Debezium connector for its database. The change events land in Kafka topics namespaced by domain (e.g., cdc.orders.*). A schema registry enforces contracts on the event format. Downstream teams consume from these topics to build analytics stores, search indexes, materialized views, audit logs, or ML feature stores.
This decouples data producers from consumers entirely. The Orders team does not need to know that the Analytics team reads their changes, and vice versa. Kafka acts as the durable, replayable log that connects the domains.
In practice, you also need governance over topic naming, schema evolution rules, data classification, and access controls. CDC topics often carry sensitive data (customer PII, payment details), so encryption, RBAC, and audit logging are essential at the Kafka layer.
Common Kafka CDC pitfalls
Replication slot growth. If a consumer falls behind or a connector stops, PostgreSQL retains WAL segments for the replication slot indefinitely. This can fill the disk. Monitor pg_replication_slots and set max_slot_wal_keep_size as a safety limit.
Schema evolution. When a source table schema changes (added columns, type changes), the CDC events change shape. Use a schema registry with compatibility checks (backward, forward, or full) to prevent breaking downstream consumers. Debezium integrates with Confluent Schema Registry and Apicurio.
Snapshot handling. On first startup, Debezium takes an initial snapshot of the existing data. For large tables, this can take hours and produce a burst of messages. Plan capacity accordingly and consider using snapshot.mode=no_data (Debezium 2.6 or later) if you only need changes going forward.
Ordering guarantees. Debezium produces events in commit order within a single table partition. If you need strict ordering across tables or across partitions of the same table, you need to handle this in your consumer logic or use single-partition topics (which limits throughput).
Tombstone records. Debezium emits a tombstone (null value) after a delete event by default. This is required for Kafka log compaction to work correctly, removing the key entirely from the compacted topic. Make sure your consumers handle null values.
Common Kafka CDC problems and fixes
The pitfalls above each have a fix. Four situations need a plan before a Debezium pipeline reaches production: initial snapshots, schema changes, replication lag, and connector restarts. The examples below use the Debezium PostgreSQL connector, and the fixes come from its reference documentation.
Initial snapshots. By default, Debezium snapshots every captured table on first start, which is slow for large tables. One fix is an incremental snapshot, which captures each table in configurable chunks while the connector keeps streaming changes, and which can be resumed if interrupted. To start one, create a signaling table, set signal.data.collection to it, and insert an ad hoc snapshot signal, as described in the triggering steps. If history is not needed, setting snapshot.mode to no_data (see the snapshot mode options) skips snapshots entirely, but only when all the data of interest is still reflected in the WAL. The no_data mode requires Debezium 2.6 or later; on earlier versions, such as the 2.5 image in the example above, the PostgreSQL connector uses snapshot.mode=never instead (see the 2.5 connector documentation).
Schema changes. A change to a source table changes the shape of its CDC events, so downstream consumers can break. The fix is a schema registry with compatibility checks, and the schema registry tools guide compares the options. The PostgreSQL connector does not support schema changes while an incremental snapshot is running, so schedule DDL outside snapshot windows.
Replication lag. The WAL grows when the connector does not acknowledge its position. One documented cause is a low-traffic database sharing a server with a high-traffic one, and a stopped connector has the same effect. The fix for the shared-server case is to set heartbeat.interval.ms and, if needed, heartbeat.action.query to write to a heartbeat table, so the connector keeps confirming its position, as described in the WAL disk space section. The max_slot_wal_keep_size setting remains the safety limit. Check confirmed_flush_lsn and restart_lsn in pg_replication_slots to see where the slot stands. For lag in the consumers reading the CDC topics, see Kafka consumer lag monitoring tools.
Connector restarts. A restart does not lose events, but it can duplicate them. When Kafka Connect runs in distributed mode and a process stops gracefully, its tasks move to another process and continue where they stopped. After a crash, tasks restart from the last recorded offset, so some events may be sent again. The fix is to make consumers idempotent, for example by applying changes by primary key, and to watch task state so a failed task is restarted quickly. Kpow can restart failed connectors automatically, as shown in monitoring Kafka CDC pipelines with Kpow below. The Kafka Connect troubleshooting guide and Kafka Connect monitoring tools cover that side.
Monitoring Kafka CDC pipelines with Kpow
CDC connectors are long-running processes, and they fail silently more often than you would like. A connector task might enter a FAILED state because of a WAL slot issue, a schema change, or a network partition. Without monitoring, these failures go unnoticed until downstream systems start serving stale data.
Kpow gives you real-time visibility into Kafka Connect clusters alongside the rest of your Kafka infrastructure.
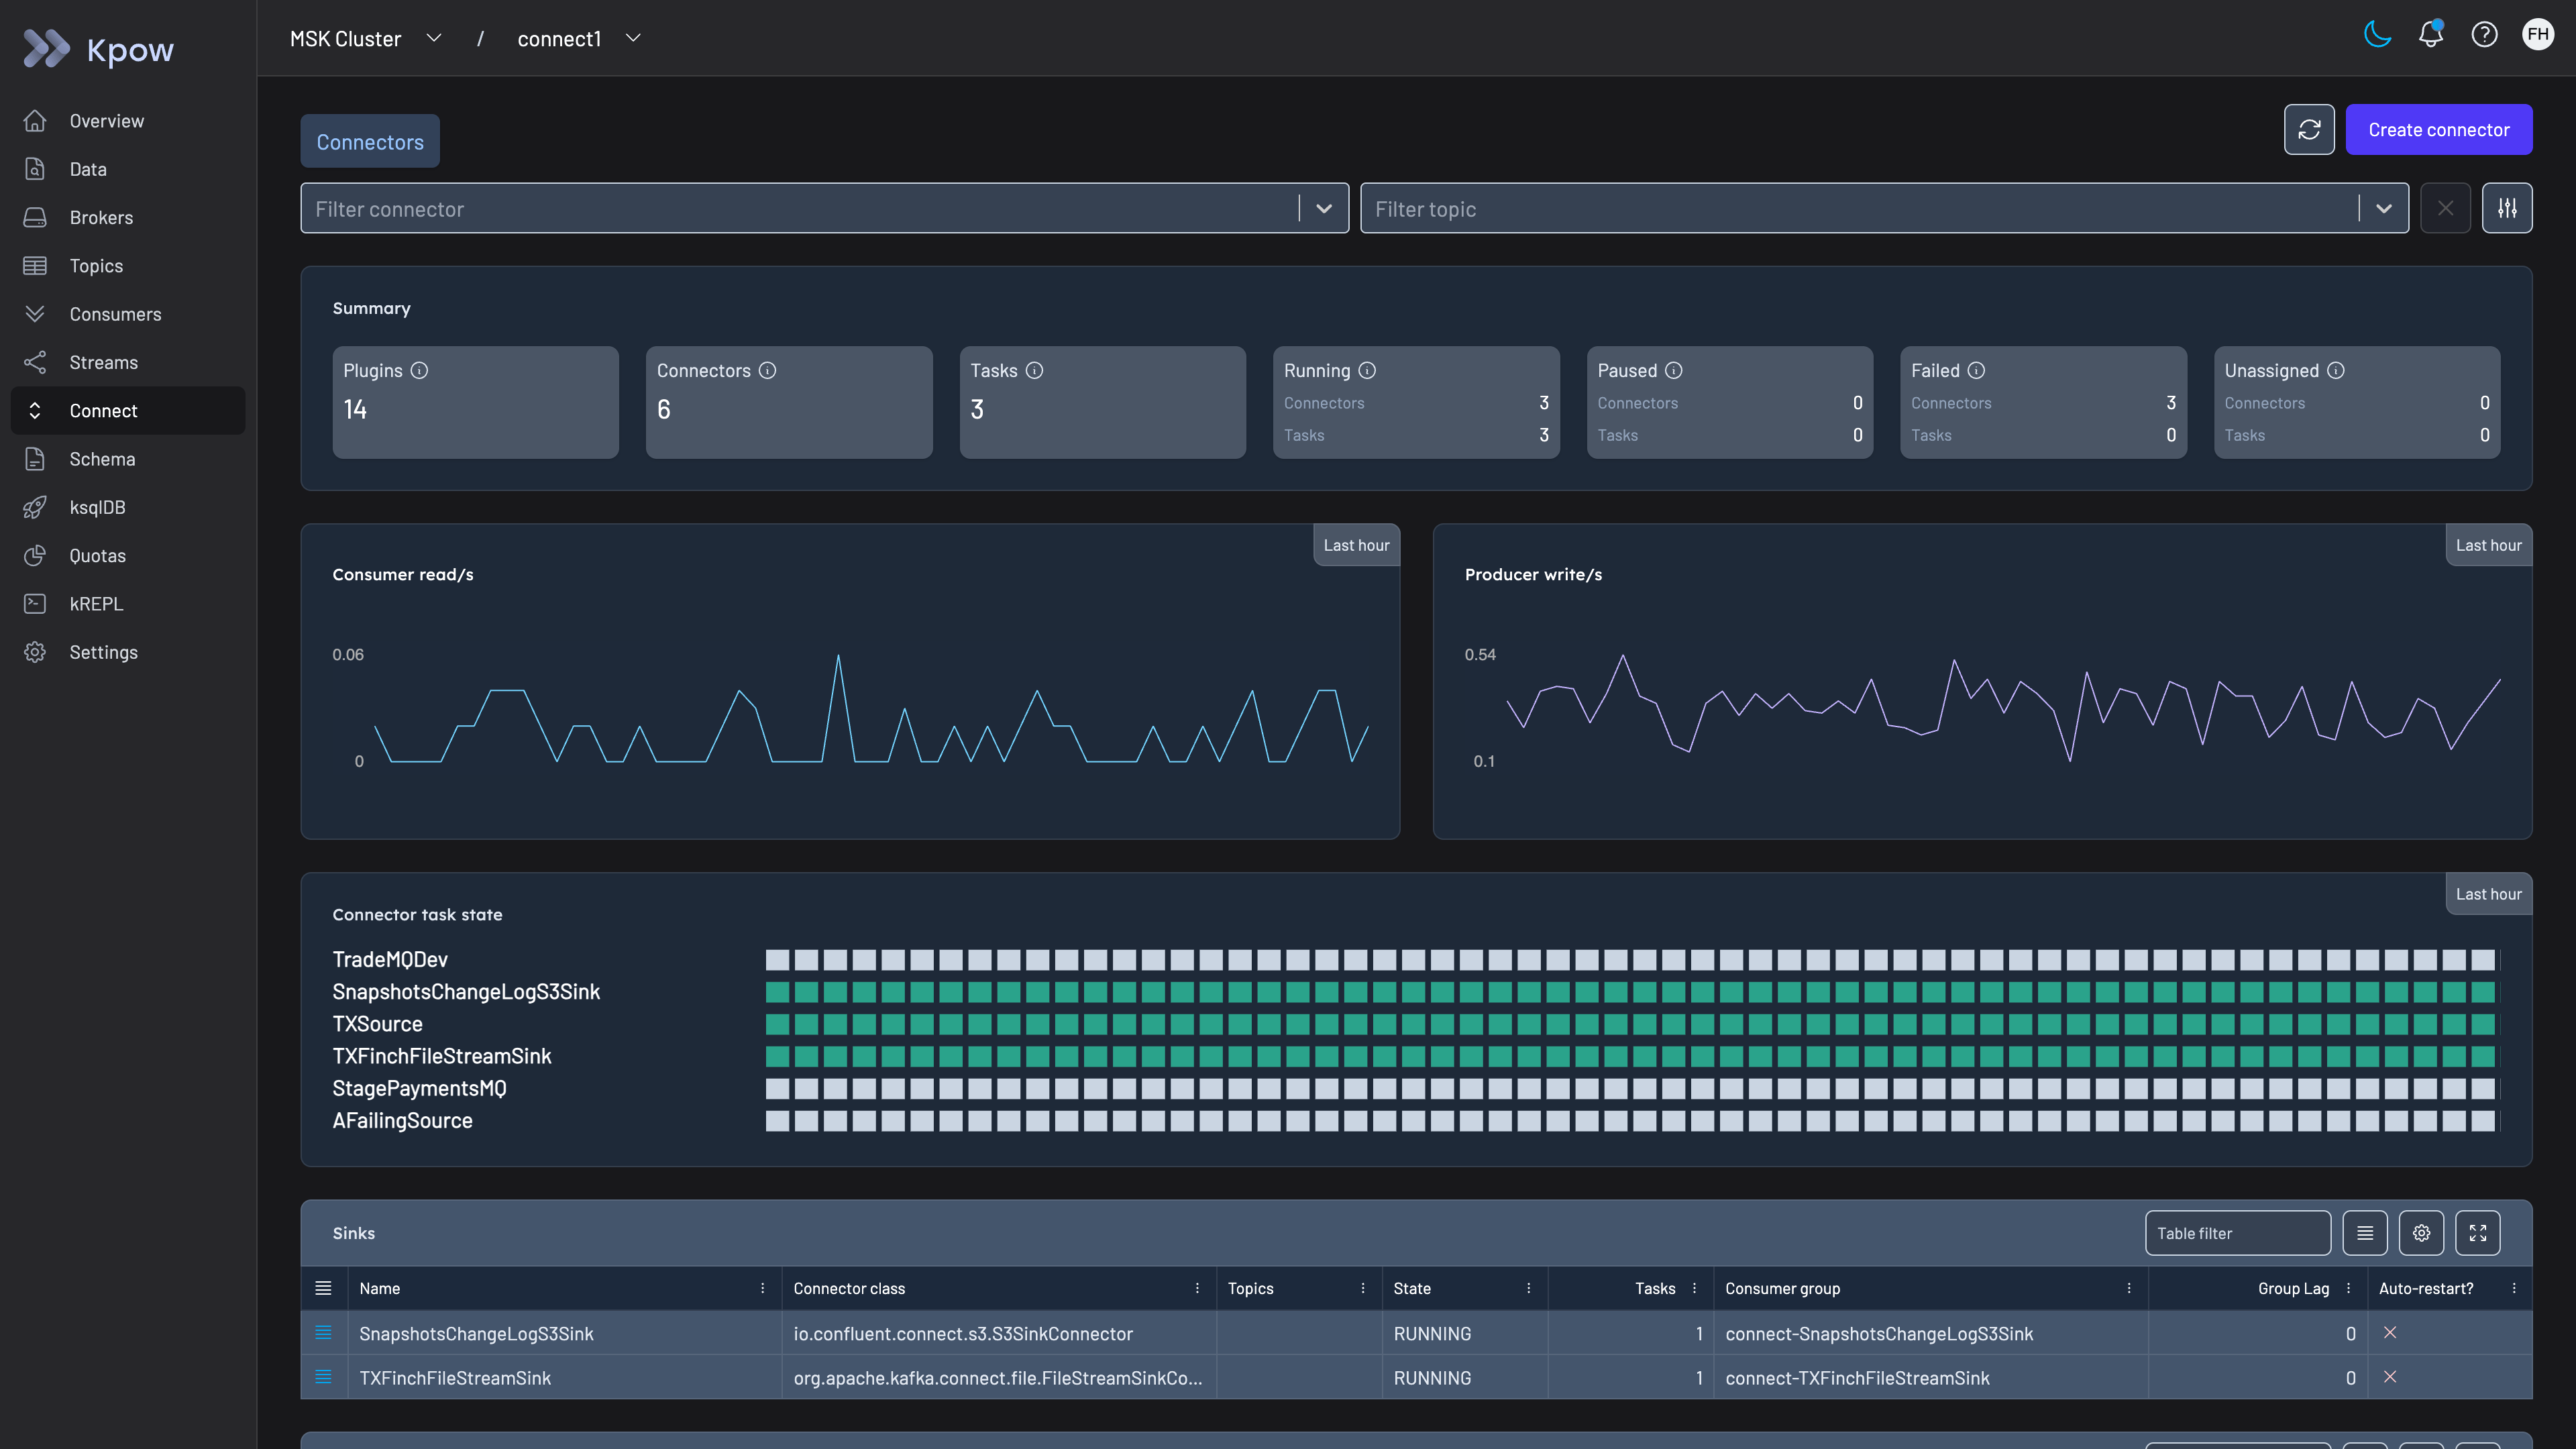
Reviewing Kafka Connect connector and task status in Kpow
Specifically for CDC pipelines, Kpow helps with:
Connector and task health. Kpow surfaces the status of every connector and task (RUNNING, PAUSED, FAILED, UNASSIGNED) in a single view. You can set up Prometheus alerts via Kpow’s metrics endpoint to fire when a connector task enters an error state, so your team gets notified immediately rather than discovering the failure through downstream symptoms.
Consumer lag tracking. The CDC topics produced by Debezium are consumed by downstream services. Kpow tracks consumer group lag across all topics and partitions, letting you see at a glance whether any consumer is falling behind. For CDC, rising lag means your derived datastore is diverging from the source of truth.
Automatic connector restarts. Kpow can automatically restart failed connectors at configurable intervals. You specify which connectors to auto-restart (by exact name or wildcard pattern), and Kpow monitors them at one-minute intervals. All restart actions are logged in the audit trail and can be forwarded to Slack for team visibility.
Operational controls. From Kpow’s UI or OpenAPI-based REST API, you can pause, resume, restart, or delete connectors, inspect task stack traces when errors occur, and view or edit connector configurations. This gives your on-call engineers a single interface for triaging CDC issues without needing to hit the Kafka Connect REST API directly.
Multi-cluster support. If you run CDC connectors across multiple Kafka clusters or environments (dev, staging, production), Kpow manages them all from a single instance with role-based access controls and audit logging.
Governance for regulated teams. CDC topics carry row-level customer data, so Factor House recommends Kpow Enterprise for teams in regulated industries that need to control who can see it. Kpow Enterprise adds role-based access control, server-side data masking policies for PII so the unmasked value never reaches the browser or API response, a full audit log of every action available through the UI, a webhook or an internal Kafka topic, and SSO through any LDAP, SAML or OAuth2 provider. Kpow runs as a single container in your own environment, including fully offline in an air-gapped network, so no CDC data leaves your infrastructure.
CDC is one of those patterns where the setup is the easy part. Keeping it running reliably at scale, across multiple source databases and dozens of connectors, is where the operational complexity lives. Kpow reduces that complexity by consolidating connector health, consumer lag, topic throughput, and cluster metrics into a single tool.
You can start free with Kpow Community Edition on up to 3 clusters or explore the full documentation at docs.factorhouse.io.
Kafka CDC FAQ
What is the difference between CDC and ETL?
CDC captures each committed row-level change as it happens, while ETL extracts, transforms, and loads datasets, usually in batches. The two combine well: see Kafka CDC versus ETL for the comparison.
What is CDC in Kafka?
CDC in Kafka streams row-level inserts, updates, and deletes from a database into Kafka topics, typically with Debezium running on Kafka Connect. See What is Kafka change data capture for details.
Is a managed CDC or custom Kafka consumers less work?
Managed CDC tools like Debezium handle snapshotting, ordering, schema changes, and replication slot management out of the box. Custom Kafka consumers require you to implement all of this logic yourself. For most teams, managed CDC is significantly less work to operate at scale.
Is it possible to implement CDC without managing Kafka infrastructure?
Yes. Managed Kafka services such as Confluent Cloud, Amazon MSK, or Aiven for Apache Kafka handle cluster provisioning, scaling, and operations for you. This lets teams focus on CDC pipeline configuration rather than infrastructure management.
How should teams handle schema changes in a Kafka CDC pipeline?
Register every CDC topic with a schema registry and enforce compatibility rules (backward or full) before deploying schema changes. This ensures downstream consumers are notified of changes in advance. Pair this with a runbook covering steps to update connectors and consumers when breaking changes are unavoidable.
For the operational side of what you build here, see the complete guide to Kafka.
Where CDC fits among the broader patterns, and the business case for it, is covered in Kafka use cases.