Overview
In today's data-driven world, the ability to process and analyze information in real-time is a significant competitive advantage across many industries. Whether it's tracking top-selling products in e-commerce, identifying trending topics on social media, or monitoring high-performing assets in finance, real-time analytics pipelines are essential for gaining immediate insights.
This post explores a complete, open-source project that demonstrates how to build a real-time "Top-K" analytics pipeline. You'll learn how to ingest a continuous stream of data, process it on the fly to compute key performance metrics, and visualize the results on an interactive dashboard.
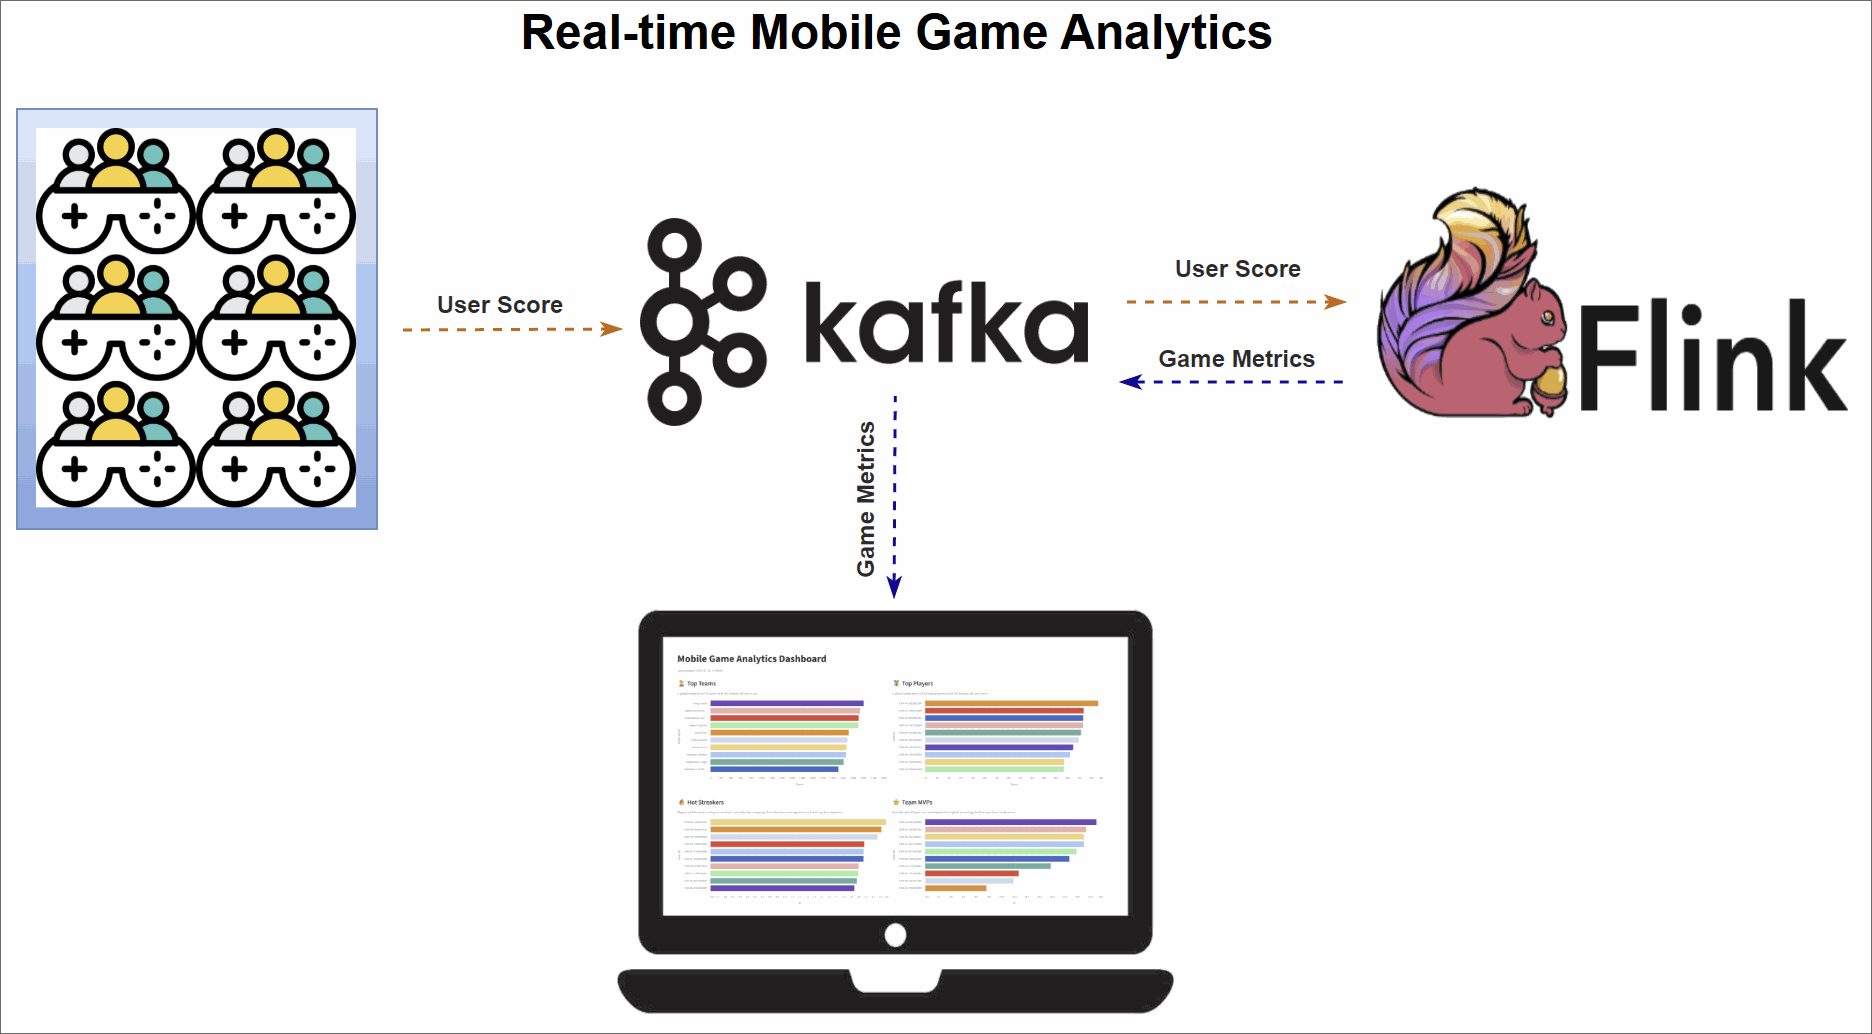
The core of this project is a robust data pipeline that can be broken down into three key stages:
- Data Generation: A Python script continuously generates a stream of simulated user events, which are then published to an Apache Kafka topic.
- Metrics Processing: Four distinct Apache Flink SQL jobs consume the raw data stream from Kafka. Each job is tailored to calculate a specific real-time leaderboard metric: Top Teams, Top Players, Hot Streakers, and Team MVPs. The results are written to their own dedicated Kafka topics.
- Dashboard Visualization: A Streamlit web application reads the processed metrics from the Flink output topics and presents them on a dynamic, real-time dashboard, offering at-a-glance insights into performance.
💡 The complete project, including all source code and setup instructions, is available on GitHub.
🚀 This project uses Factor House Local to spin up the development environment. See Introduction to Factor House Local to learn more about experimenting with modern data architectures using Kafka, Flink, Spark, Iceberg, and Pinot.
Diving into the Real-Time Metrics
The pipeline continuously computes four different leaderboard-style metrics using Flink SQL. A DDL script initially sets up the necessary source and sink tables. The source table, user_scores, reads directly from a Kafka topic. Each Flink SQL query consumes this stream, performs its calculations, and writes the output to a corresponding sink table (top_teams, top_players, hot_streakers, or team_mvps). These sink tables use the upsert-kafka connector, which ensures that the leaderboards are continuously updated as new data arrives.
Top Teams: This metric identifies the top 10 entities (grouped as "teams") with the highest cumulative scores, providing a global view of group performance. The underlying Flink SQL query groups the data by
team_id, calculates a running sum of scores, and then ranks the teams. To ensure accuracy over long periods, the state for this data has a time-to-live (TTL) of 60 minutes.Top Players: Similar to the Top Teams metric, this leaderboard showcases the top 10 individual entities (or "players") with the highest scores. The logic is much the same: the stream is grouped by
user_id, a cumulative score is calculated, and the entities are ranked globally. This also has a 60-minute TTL to maintain consistent stats over extended sessions.Hot Streakers: This metric is designed to highlight the top 10 entities currently on a "hot streak," meaning their short-term performance is significantly outpacing their historical average. The query for this uses sliding time windows to calculate a short-term average (over 10 seconds) and a long-term average (over 60 seconds). The ratio between these two averages determines the "hotness." Since this metric focuses on recent activity, it uses a shorter state TTL of 5 minutes.
Team MVPs: This metric first identifies the Most Valuable Player (MVP) for each team—the entity that contributed the largest percentage of the team's total score. It then ranks these MVPs across all teams to find the top 10 overall. This is achieved using Common Table Expressions (CTEs) in SQL to first calculate total scores per entity and per team, and then these are joined to determine each entity's contribution ratio.
Together, these metrics offer a rich, real-time view of system dynamics, highlighting top-performing groups, standout individuals, and rising stars. The final results are streamed to a responsive dashboard that displays the leaderboards in continuously refreshing bar charts, with each chart powered by its own dedicated Kafka topic.
Conclusion
This project serves as a practical blueprint for building powerful, real-time analytics systems. By combining the high-throughput messaging of Apache Kafka, the stateful stream processing of Apache Flink, and the rapid UI development of Streamlit, you can create sophisticated pipelines that deliver valuable insights with minimal latency.
The "Top-K" pattern is a versatile one, applicable to countless domains beyond the example shown here. The principles of stream ingestion, real-time aggregation, and interactive visualization form a solid foundation for any developer looking to harness the power of live data. We encourage you to clone the repository, run the project yourself, and adapt the architecture to your own unique use cases.