Kafka audit trail with Kpow: who changed what, streamed to Slack
ProductA topic was deleted overnight, or a consumer group’s offsets were reset, and the first question in the incident is who did it and when. Apache Kafka keeps no built-in record of who performed an administrative change. The broker’s authorizer logs its decisions to a dedicated logger, kafka.authorizer.logger, which the logging configuration shipped with Kafka writes to kafka-authorizer.log. By default that log records denied requests. Allowed requests, including a successful topic deletion, are logged only when the logger is set to DEBUG, so on a default configuration the broker has no record of who deleted the topic.
This guide shows how Kpow records every user action taken through it in an audit log, and how to stream those events into a Slack channel with a webhook so that the next change is visible when it happens.
Overview
Part 1 of the observability series covered Kpow’s diagnostic interface for root cause analysis, and Part 2 covered feeding Kpow’s pre-calculated metrics into Grafana dashboards. This part covers user actions. As more teams use a Kafka cluster, administrative actions such as managing topics, editing ACLs and resetting consumer offsets become an operational risk.
This is Part 3 of the Kafka observability with Kpow series.
- Part 1: Rapid Kafka diagnostics: a unified workflow
- Part 2: Beyond JMX: Kpow metrics in Grafana dashboards
- Part 3: Kafka audit trail with Kpow (this article)
About Factor House
Factor House builds tooling for engineers who run Apache Kafka® and Apache Flink®.
Kpow for Apache Kafka is Factor House’s tool for Kafka management and monitoring.
Try Kpow Enterprise for free, which includes the audit log, or explore the live multi-cluster demo environment to see Kpow in action.
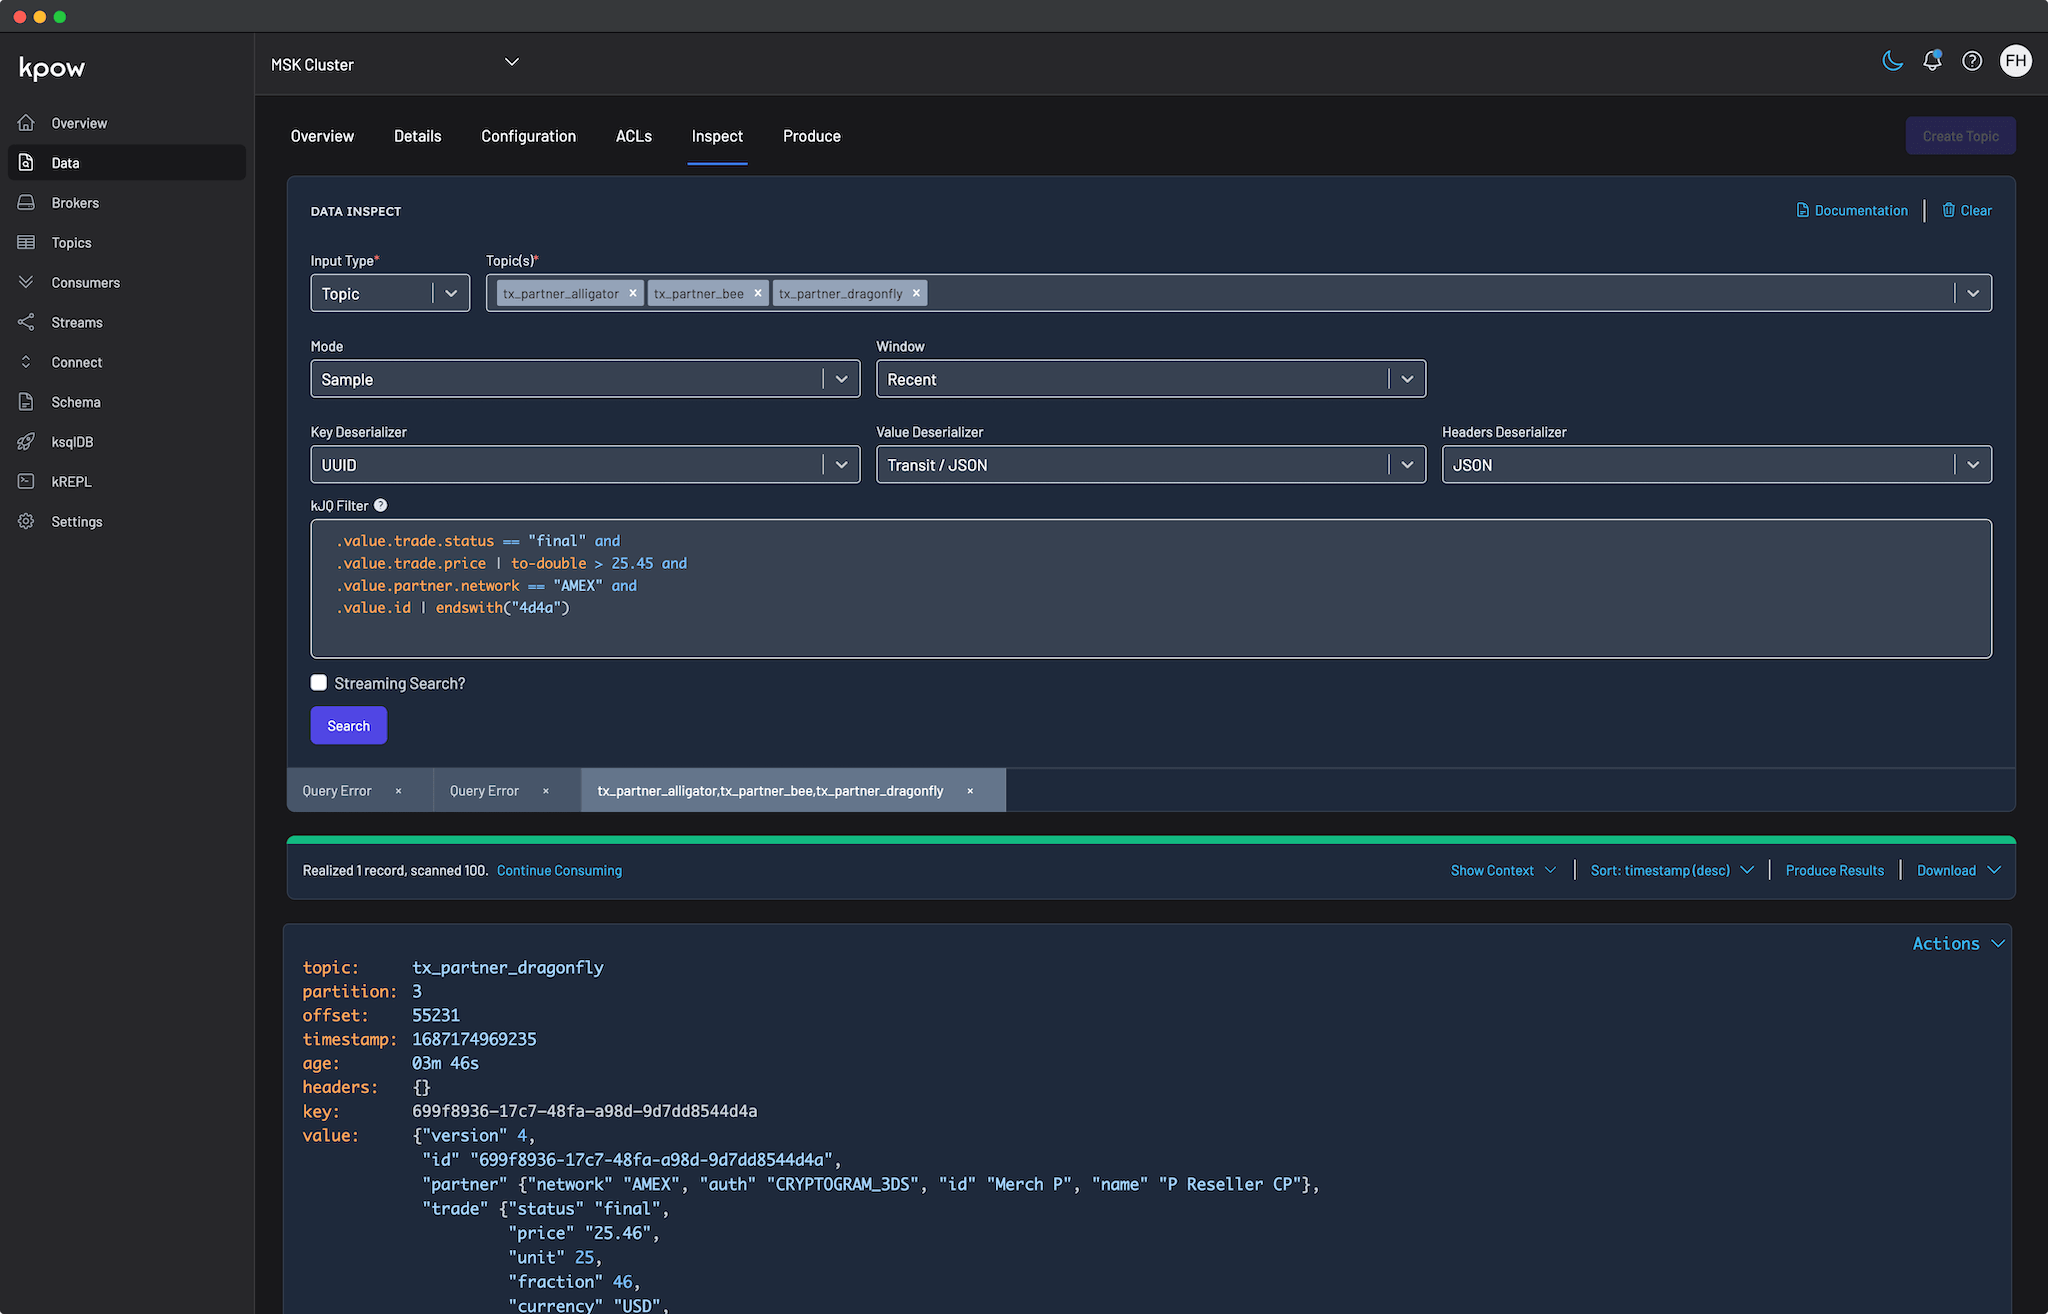
The problem: no record of admin changes
A critical topic is deleted, or a script resets consumer offsets and a consumer group reprocesses a large amount of data.
With no audit trail, there is no central record of who made the change, when, or why. Incident response stalls while platform engineers ask around to find out who changed what that day.
It is also a compliance risk. In regulated industries, security and compliance audits expect a searchable record of administrative changes to critical data infrastructure.
Common workarounds: approval tickets and log parsing
Without a dedicated tool, teams usually fall back on one or both of two approaches, and both slow teams down.
Option A (approval tickets): Platform teams lock down the cluster, and every configuration change goes through a separate ticketing process and waits for approval. Without an automated approval workflow, this manual gatekeeping slows developers down and rules out a self-service data platform.
Option B (log parsing): Teams parse Kafka’s raw server logs to piece together an audit trail. The parsing is brittle, hard to maintain and hard to alert on in real time, so a destructive change is usually found only after the incident it caused.
Tools that record Kafka admin actions are compared in Kafka audit logging tools.
How Kpow records and streams admin actions
Kpow handles this in two parts: access control that prevents unwanted changes, and an audit log that records the changes that are made.
First, Kpow’s Role-Based Access Control (RBAC) allows you to safely delegate self-service capabilities by mapping your organization’s existing user groups to specific Kafka actions. Instead of locking down the cluster entirely, you can enforce granular permissions. For example, you can grant application teams full control to edit, produce to, and inspect their specific domain topics (such as payments_*), while explicitly denying access to sensitive audit topics. Meanwhile, platform administrators retain the global authority to manage Kafka ACLs and oversee cluster-wide infrastructure.
Second, as part of its Data Governance capabilities, Kpow automatically records every authorized user action in a secure audit log. This captures state-changing actions known as mutations (such as creating topics, resetting offsets, or modifying ACLs) as well as read-only queries (such as searching topic data via Data Inspect). Each entry records who made the request, what it contained, and whether RBAC allowed or denied it, and the log is available in the Kpow UI, as a webhook, or as a Kafka topic retained for as long as you configure Kafka to keep it.
Rather than administrators checking a dashboard for these logs, Kpow’s Webhook Integration pushes the events to the tools your team already uses: Slack, Microsoft Teams, or any custom platform through a generic HTTP webhook.
Putting it into Practice: Configuring a Slack Audit Trail
The walkthrough below sends Kafka administrative actions to a Slack channel as they happen.
Product demo · 3 min
Apache Kafka audit logging: Kpow demo
Chad Harris walks through audit logging in Kpow: how every meaningful action is recorded on a Kafka topic you can inspect directly, tracing an entry back to the exact query and data it exposed, and forwarding audit events to Slack, Teams, or a SIEM via webhook.
Step 1: Configure the Slack App and Webhook
To integrate Kpow with Slack, you need to create a Slack App and generate an incoming webhook URL.
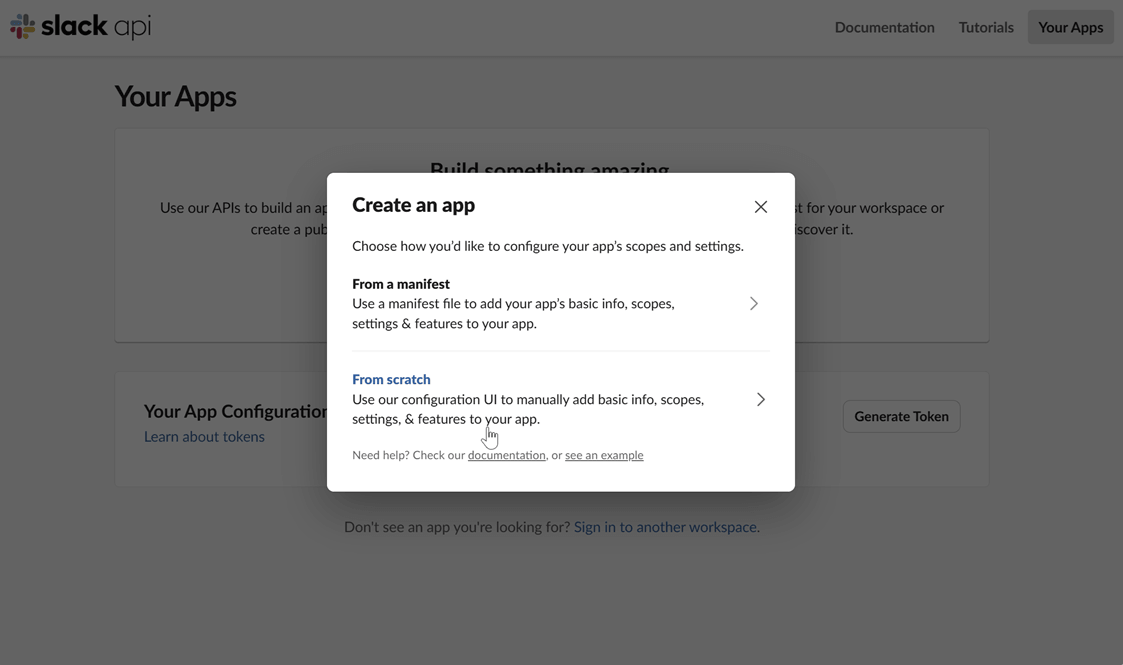
Create a Slack app: Navigate to the Slack API website and click on “Create New App”. Choose to create it “From scratch”.
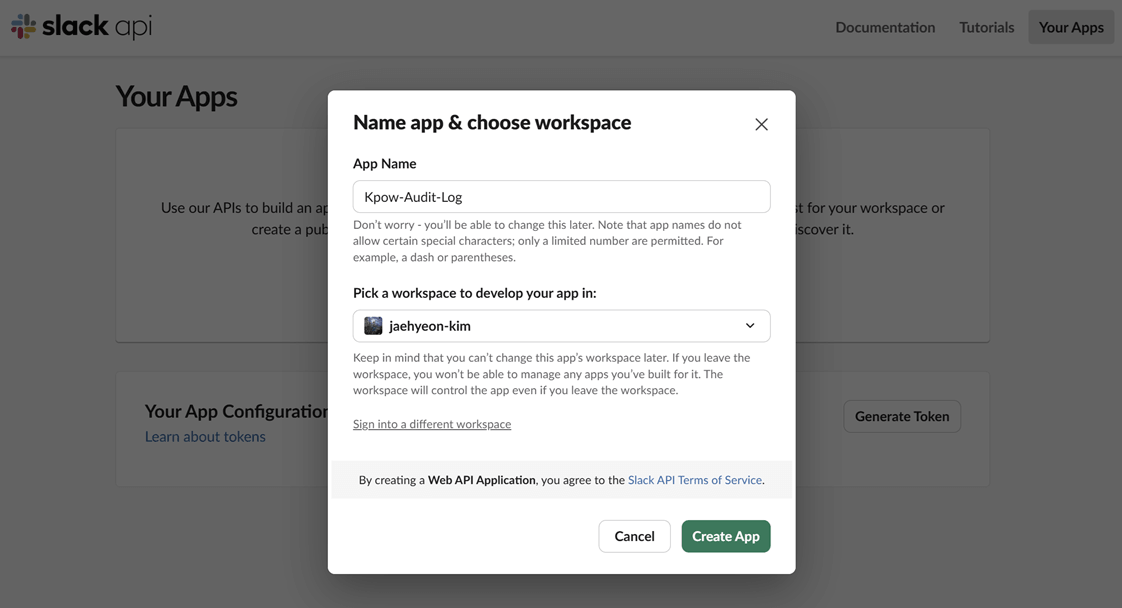
Name your app and choose a workspace: Provide a name for your application and select the Slack workspace you want to post messages to.
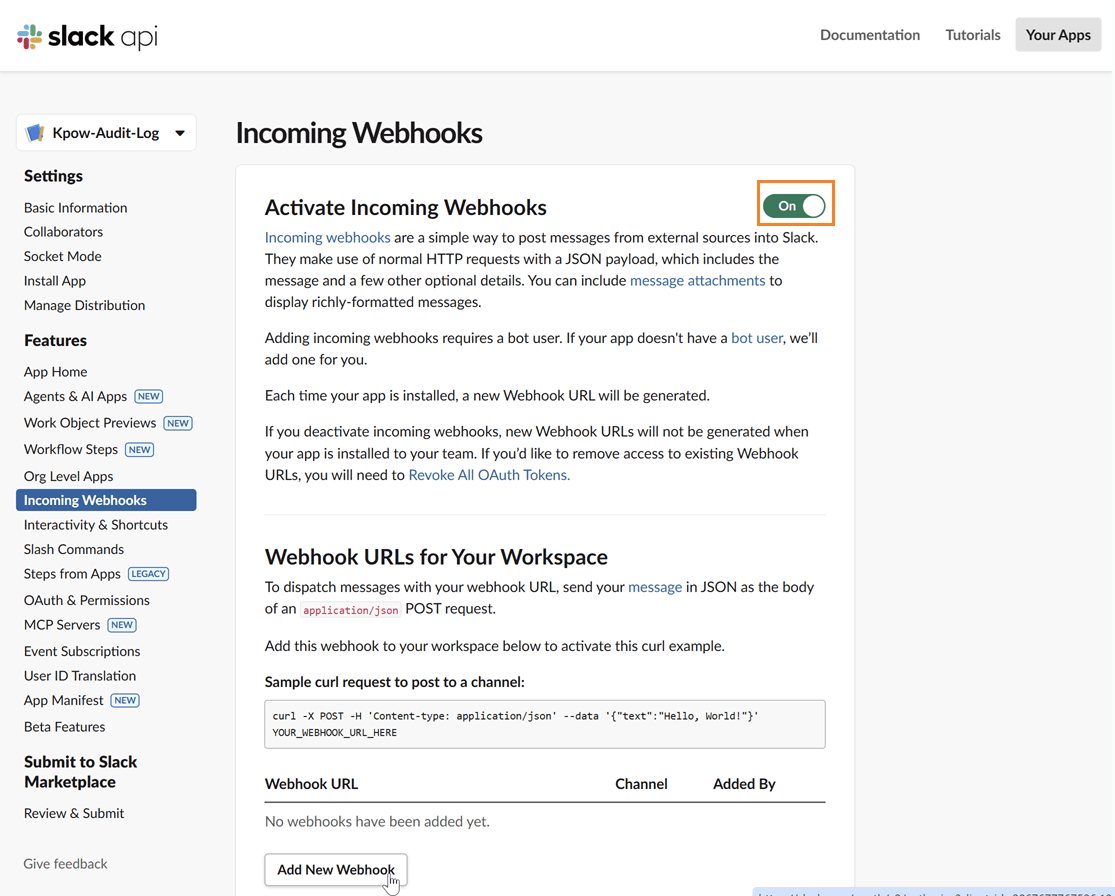
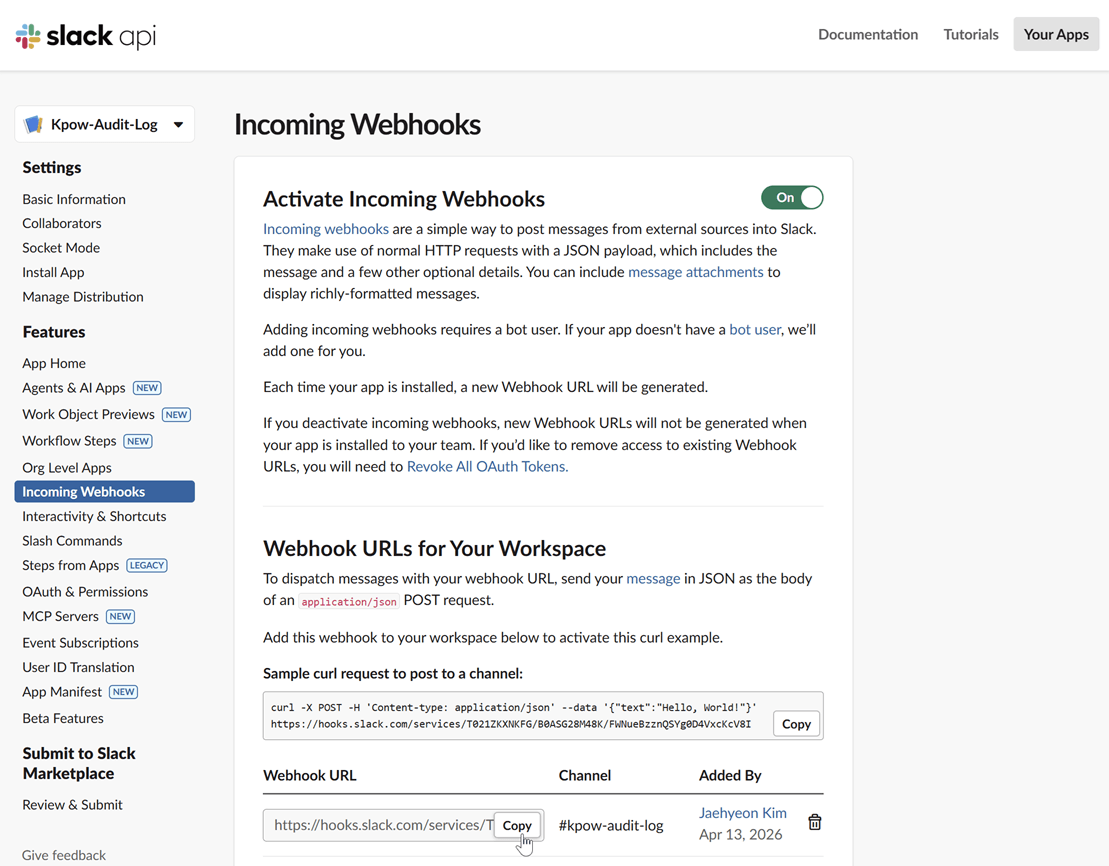
Enable incoming webhooks: In your app’s settings page, go to “Incoming Webhooks” under the “Features” section. Toggle the feature on and then click “Add New Webhook to Workspace”.
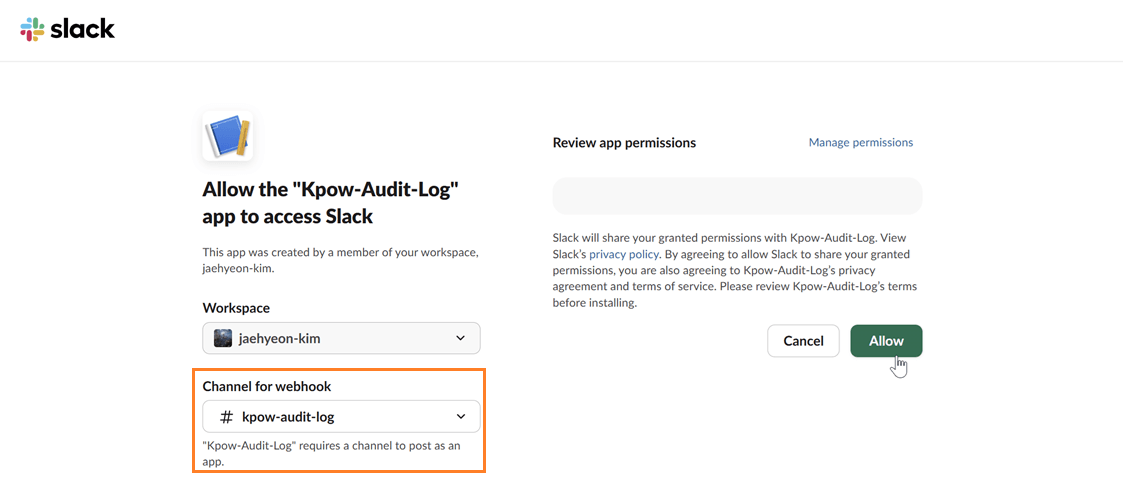
Select a channel: Choose the channel where you want the Kpow notifications to be posted and click “Allow”.
Copy the webhook URL: After authorizing, you will be redirected back to the webhook configuration page. Copy the newly generated webhook URL. This URL is what you will use to configure Kpow.
Step 2: Launch Kpow with Webhook Environment Variables
Once you have your webhook URL, you can configure Kpow using a few simple environment variables.
Setting WEBHOOK_VERBOSITY to MUTATIONS ensures that Kpow only sends alerts for state-changing actions, preventing notification fatigue from standard data queries.
WEBHOOK_PROVIDER: slack
WEBHOOK_URL: <SLACK-WEBHOOK-URL>
# Accepts MUTATIONS, QUERIES, or ALL (default: MUTATIONS)
WEBHOOK_VERBOSITY: MUTATIONS
Step 3: Verify the Integration
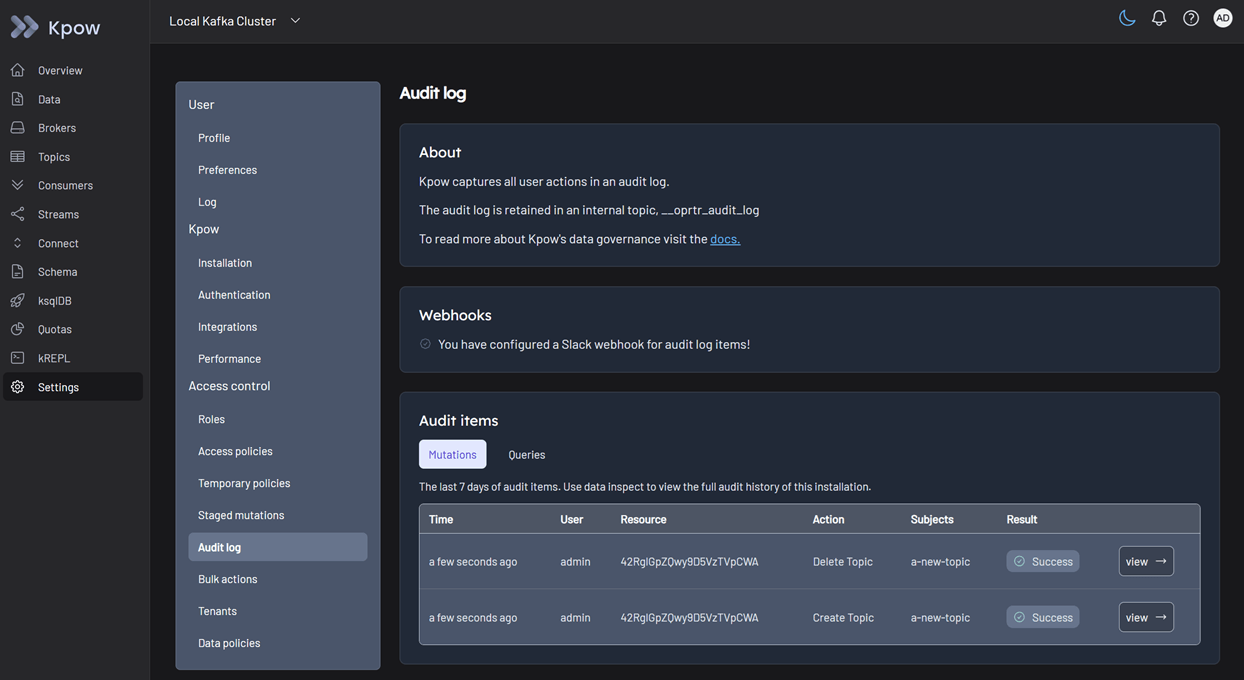
To test the integration, perform a state-changing action in Kpow, such as creating and deleting a topic.
View audit logs
After performing these actions, you can verify they have been logged by navigating to Settings > Audit log in the Kpow UI.
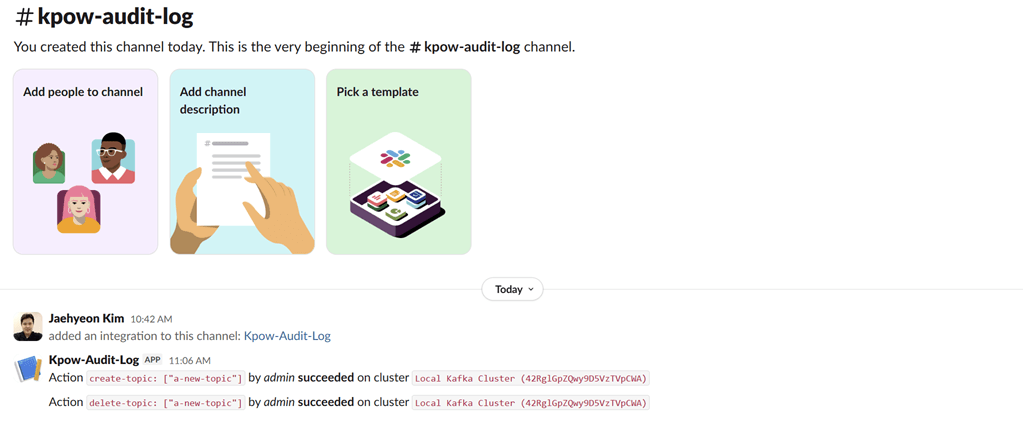
On the Slack channel, you should see messages detailing the actions. Each message includes information such as the user who performed the action, the type of action (e.g., create-topic), and the cluster environment name.
Conclusion
Without visibility into administrative actions, platform teams rely on approval tickets or log parsing, and both slow developers down and lengthen incident response.
Granular RBAC limits who can make a change, and streaming Kpow’s audit log to Slack, Microsoft Teams or a custom webhook shows the team each change as it happens. Auditors get a record of administrative changes, and developers keep self-service access.
This is the last part of the three-part observability series: diagnostics in the Kpow UI (Part 1), Kpow metrics in Prometheus and Grafana (Part 2), and the audit trail streamed by webhook (Part 3).
Next steps
Explore Kpow in your own environment: try Kpow Enterprise for free. The audit log and Slack integration are Enterprise features.
For help managing your Kafka environment, contact the Factor House engineering support team at [email protected].
Governance is one part of running Kafka well. The complete guide to Kafka covers the rest.