Kafka consumer lag: how to find the cause and monitor it
GuidesIf lag on a consumer group is increasing, staying flat, or behaving unexpectedly, it is not always obvious whether you are looking at a real problem, a temporary backlog, or a misleading metric. This article explains what Kafka consumer lag is, why it happens, and several practical ways to monitor it, so you can tell which of the three you are looking at.
Kafka consumer lag is one of the most common operational signals teams rely on to understand whether their event-driven systems are healthy. It is also one of the most common misunderstandings. When teams refer to consumer lag operationally, it means the following to them:
- Consumer lag represents how far a consumer group is behind the latest data in a Kafka topic.
- Lag is not inherently bad, but unbounded or growing lag usually points to a system issue.
- Monitoring lag effectively requires understanding partitions, offsets, and consumer group behavior.
- There are multiple ways to monitor consumer lag, ranging from built-in tooling to dedicated monitoring products.
- Reducing lag often involves addressing downstream constraints, not Kafka itself.
What is Kafka consumer lag?
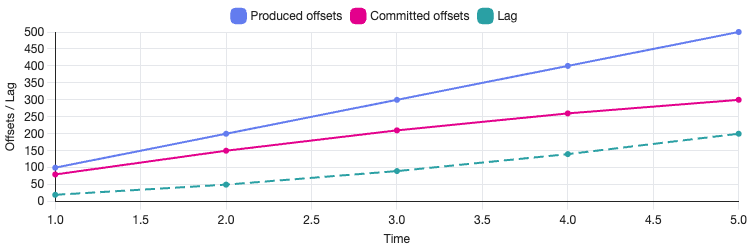
Kafka consumer lag is the difference between:
- the latest offset written to a partition (the log end offset), and
- the offset most recently committed by a consumer group for that partition.
In practical terms, lag indicates how many records a consumer group has yet to process. If a topic partition has a latest offset of 10,000 and the consumer group has committed offset 9,500, the lag for that partition is 500.
Lag is tracked per partition, but it is often aggregated to give a topic-level or consumer-group-level view.
It is important to note that lag is not a measure of time. A lag of 10,000 messages could represent milliseconds of work or several hours, depending on message size, processing cost, and consumer throughput.
Causes of consumer lag
Consumer lag occurs whenever producers write data faster than consumers can process it. This can happen for many reasons, including the following.
Insufficient consumer capacity
If there are fewer consumer instances than partitions, some partitions cannot be processed in parallel and will inevitably fall behind. Lag can also build up when consumers are under-provisioned in terms of CPU, memory, or I/O, even if the number of instances matches the partition count. In these cases, consumers may technically be healthy but unable to sustain the required throughput.
Slow downstream systems
Kafka promotes decoupling, but consumers frequently interact with external systems such as databases, APIs, or object storage. When these downstream dependencies become slow or intermittently unavailable, consumer processing time increases and messages spend longer waiting to be handled. Over time, this reduced throughput shows up as growing lag, even if the Kafka cluster itself is operating normally.
Rebalances and restarts
Consumer group rebalances temporarily pause consumption while partitions are reassigned. Occasional rebalances are expected, but repeated rebalances, often caused by frequent deployments, crashes, or unstable group membership, can significantly reduce effective processing time. In these situations, lag may fluctuate or accumulate despite sufficient consumer capacity. What is Kafka rebalancing? covers what triggers a rebalance and the timeouts that control it.
Uneven partition load
Kafka distributes records by partition, but traffic is rarely uniform across them. A small number of partitions may receive a disproportionate share of messages, creating so-called “hot partitions.” Even when overall throughput appears healthy, lag can accumulate on these partitions and increase end-to-end processing latency for downstream systems.
Intentional backlog
In some scenarios, consumer lag is expected and planned for. Batch-oriented consumers, replay jobs, or backfill processes often operate behind the head of the log by design. In these cases, lag reflects scheduling or workflow decisions rather than a system failure and should be interpreted in that context.
Benefits of consumer lag monitoring
Monitoring consumer lag provides early signals that your system is under pressure. Unlike error logs or alerts triggered after a failure, lag typically increases before users notice an issue.
Effective lag monitoring helps you:
- detect throughput mismatches between producers and consumers
- identify which consumer groups are affected
- understand whether lag is temporary or growing over time
- correlate processing delays with deployments or infrastructure changes
When combined with partition-level visibility and operational context, lag metrics can also help distinguish between expected backlogs and genuine processing bottlenecks. For example, a brief spike during a rebalance may be benign, while steadily increasing lag after a deployment can point to a configuration or capacity issue. Used correctly, lag becomes a diagnostic tool rather than just a number on a dashboard, supporting investigation and decision-making instead of generating noise.
The monitoring options below differ in how much of that context they show. For a side-by-side comparison of the tools, including Burrow, KMinion and kafka_exporter, see Kafka consumer lag monitoring tools.
How to monitor Kafka consumer lag
There are several ways to monitor consumer lag, each with different levels of effort and visibility.
1. Using a Kafka UI like Kpow
Tools such as Kpow provide consumer group visibility out of the box, including per-partition lag, historical trends, rebalance activity, and group state transitions.
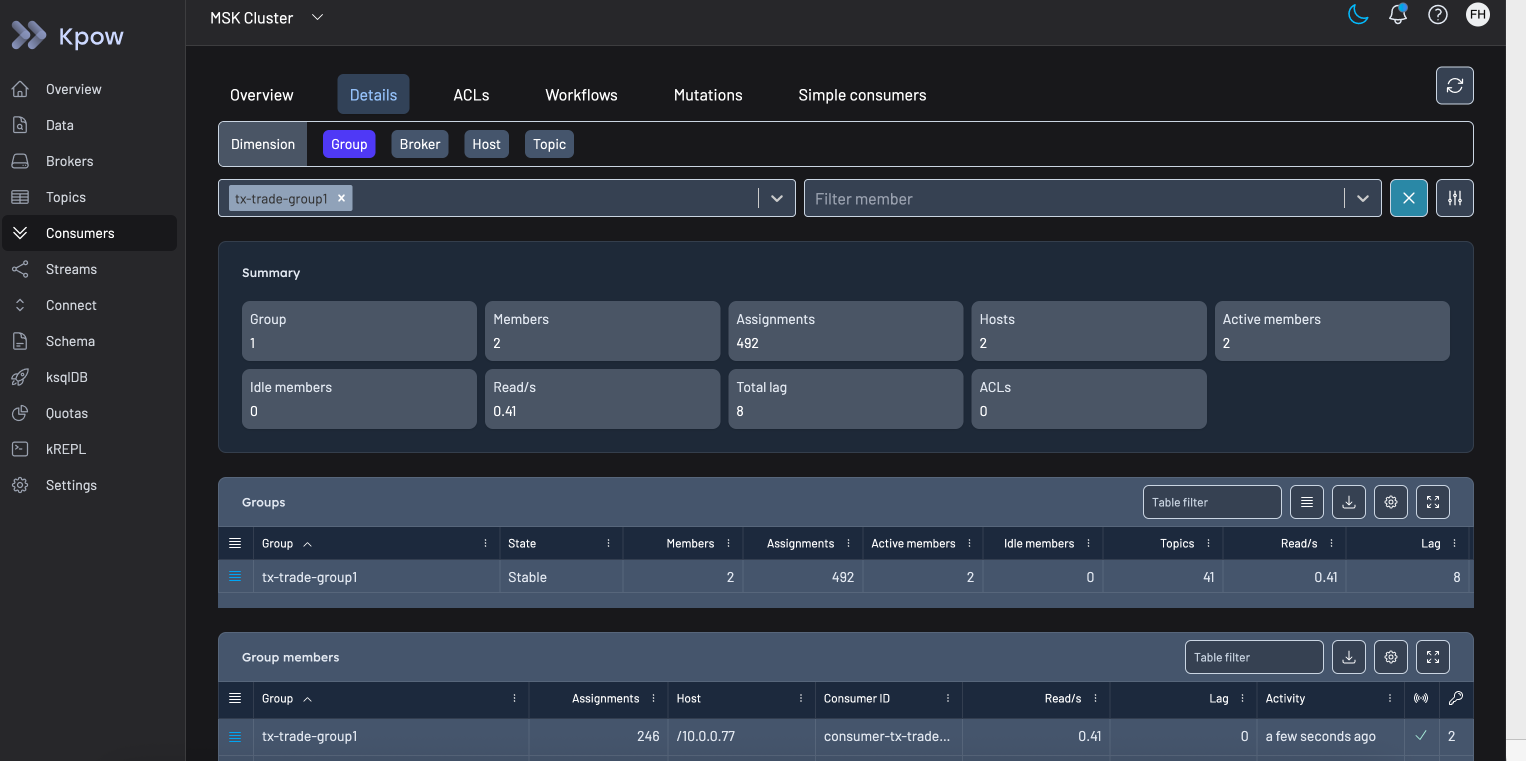
Kpow connects directly to a Kafka cluster and automatically discovers brokers, topics, partitions, and consumer groups. A key differentiator of Kpow is that it generates metrics internally without relying on JMX. This means the data it exposes is consistent across Kafka resources, avoiding the gaps and inconsistencies that often arise from JMX-based scraping pipelines. For teams integrating Kafka observability into Grafana dashboards, this makes Kpow a high-fidelity telemetry source - the approach is described in detail in Beyond JMX: Supercharging Grafana Dashboards with High-Fidelity Metrics.
In addition to lag visualisation, Kpow provides operational context that is difficult to reconstruct from metrics alone, such as rebalance history and consumer group lifecycle events. This helps distinguish between temporary backlogs caused by rebalances and sustained lag driven by throughput constraints.
Kpow also exposes administrative capabilities commonly used during troubleshooting, including consumer group offset inspection and reset operations. These actions are available directly in the UI and documented in the Kpow management guide.
You can see an example of consumer group exploration in the publicly available demo instance.
For teams that want to explore this approach, Kpow Community Edition includes the consumer lag breakdown free on up to 3 clusters.
Product demo · 6 min
Apache Kafka consumer group monitoring & lag: Kpow demo
Chad Harris walks through consumer group monitoring in Kpow: tracking group stability over time, breaking lag down to the partition level, safely resetting or skipping offsets on a running group, and using group topology to trace lag back to a host or topic.
2. Using Kafka’s command-line tools
Kafka ships with built-in scripts for inspecting consumer group offsets, such as:
kafka-consumer-groups.sh \
    --bootstrap-server broker:9092 \
    --describe \
    --group my-consumer-group
This output shows committed offsets, log end offsets, and lag per partition. While useful for ad-hoc inspection, it is not well suited to continuous monitoring or historical analysis. The other consumer group commands, including offset resets, are in Kafka CLI commands for day-2 operations.
3. Using JMX metrics
Kafka exposes consumer metrics via JMX, including lag-related measurements. Teams often scrape these metrics into Prometheus and visualize them in Grafana.
This approach offers flexibility but requires careful configuration, metric selection, and alert tuning. It also shifts the responsibility for correctness and interpretation onto the engineering team.
4. Building custom consumer instrumentation
Some teams instrument lag tracking directly within their consumers by periodically querying committed offsets and log end offsets using the Kafka Admin API.
This can provide fine-grained control, but it introduces additional complexity and maintenance overhead. In practice, most teams reserve this approach for specialized scenarios.
5. Cloud-managed monitoring integrations
Managed Kafka offerings such as Amazon MSK integrate with CloudWatch, exposing offset and lag-related metrics at the service level. These integrations can be helpful but often lack the granularity needed for diagnosing consumer behavior at the application level.
Best practices for monitoring consumer lag
Monitor trends, not just absolute values
A stable lag that remains constant over time may be acceptable, depending on your use case. A steadily increasing lag almost always requires investigation. Set up trend-based alerts that fire when lag has been growing continuously for a defined period - for example, increasing for more than five minutes - rather than alerting on any non-zero value. This reduces alert fatigue while catching genuine problems early.
If lag is scraped into Prometheus with kafka_exporter, which publishes per-partition lag as kafka_consumergroup_lag, the Prometheus deriv() function expresses the same idea as an alert on the rate of change in lag rather than its absolute value. This expression fires for any partition whose lag has been growing by more than 500 messages per second across the last 10 minutes:
deriv(kafka_consumergroup_lag[10m]) > 500A static absolute threshold is less reliable. A threshold of 10,000 messages means something very different on a topic receiving one million messages per second versus one receiving one hundred: on the first it would fire constantly, and on the second a genuine problem could sit below it for hours.
Detect a stalled consumer, not just a slow one
A consumer that has stopped making progress needs a different alert from one that is slowly falling behind. Complement the trend alert with a stall detection alert for cases where the committed offset has stopped advancing entirely despite an active backlog:
sum(delta(kafka_consumergroup_current_offset[5m])) by (consumergroup, topic) == 0
and sum(kafka_consumergroup_lag) by (consumergroup, topic) > 1000
A stalled consumer with a growing backlog typically indicates a deadlocked thread, a poison-pill message blocking the processing loop, or a crashed consumer group that has not been restarted.
Burrow, the open-source lag monitoring service built at LinkedIn, separates slow consumers from stopped ones without static thresholds. It reads committed offsets from the __consumer_offsets internal topic, evaluates each partition over a sliding window of recent commits, and classifies it as OK, WARN, STALL, STOP or REWIND, rolling those up into an OK, WARN or ERR status for the group. A partition in STALL (the consumer is still committing, but the committed offset is not advancing while lag persists) is a different problem from one in STOP (the consumer has not committed recently and lag is non-zero), and a simple lag threshold would treat them the same way. Because Burrow reads offsets from the brokers rather than from the consumer process, it keeps reporting when a consumer group is offline, which client-side JMX metrics cannot do.
Watch lag by partition
Aggregate lag can hide partition-level issues. A single slow or hot partition can impact processing latency even if total group lag looks manageable. Ensure your monitoring system exposes per-partition lag so you can identify which partitions are falling behind and investigate the cause - whether that is skewed message distribution, a slow consumer instance, or an upstream producer spike. Kpow’s consumer lag view shows lag by group, topic, partition, host, and broker at once, so a single lagging partition and the host consuming it are visible in the same view.
Correlate lag with deployments and rebalances
Sudden changes in lag often coincide with consumer restarts, rebalances, or configuration changes. Observability is strongest when metrics are combined with deployment events and group state changes. Tools that surface rebalance history alongside lag trends make it significantly easier to diagnose whether a lag spike is transient or structural. If you investigate consumer lag with an AI assistant, how to troubleshoot Kafka with an AI agent covers what to ask it for and how to check its answer against the lag numbers.
Avoid alerting on every spike
Short-lived spikes are common during rebalances or traffic bursts and are often self-correcting within seconds. Alerts should focus on sustained lag growth rather than momentary increases. Using a rolling window or rate-of-change metric - rather than a raw threshold - typically produces more actionable alerts. Reserve high-priority alerts for situations where lag exceeds a threshold and remains elevated for a meaningful duration.
How to reduce consumer lag
Scale consumers horizontally
Adding consumer instances increases parallelism, as long as there are enough partitions to support it. Each partition in Kafka can only be assigned to one consumer within a group, so the maximum useful parallelism is bounded by the partition count. If you have already scaled to match partition count and lag persists, the bottleneck is likely in processing logic or downstream dependencies rather than consumer capacity.
Optimize consumer processing
Profiling message handling, batching operations, and reducing synchronous calls can significantly improve throughput. Common gains come from reducing per-message latency through asynchronous I/O, pre-fetching lookups, or processing records in micro-batches rather than one at a time. Even modest improvements in per-message processing time can translate to substantial lag reduction at scale.
Tune Kafka fetch and commit settings
Configuration such as max.poll.records, fetch.min.bytes, and commit frequency can affect how efficiently consumers process data. Increasing max.poll.records allows consumers to fetch more messages per poll cycle, which can improve throughput in high-volume scenarios. However, increasing this value also extends the time between commits, so it should be balanced against your at-least-once delivery requirements and processing latency targets. The metric to watch for each of these settings, and the order to change them in, is covered in Kafka consumer performance tuning.
Address downstream bottlenecks
Lag is often a symptom of slow databases, APIs, or storage systems. Improving these dependencies - through connection pooling, caching, batching writes, or upgrading infrastructure - can have a larger impact on lag reduction than any Kafka-side tuning. Always profile your consumer to understand where time is being spent before making changes.
Common misconceptions about consumer lag
Consumer lag is widely referenced, but often misinterpreted. A few common misunderstandings are worth addressing directly.
Lag is not a reliability indicator on its own
High lag does not automatically mean messages are being lost or skipped. Kafka retains data independently of consumer progress. A consumer group can fall behind and still process every record correctly once it catches up, provided retention limits are not exceeded.
Conversely, low or zero lag does not guarantee correctness. Consumers can commit offsets prematurely, encounter silent processing failures, or drop messages downstream while still appearing “caught up” from Kafka’s perspective.
Lag should be interpreted alongside error rates, commit behaviour, and downstream outcomes.
Lag can decrease without work being done
Lag shrinking does not always mean consumers are processing records faster. During rebalances, offset resets, or consumer group recreation, committed offsets can move forward abruptly. This can make lag appear to recover even though records were skipped or reassigned.
If lag drops suddenly without a corresponding increase in consumer throughput, it is worth verifying offset commit patterns and rebalance history.
Aggregate lag hides operational detail
Most dashboards default to total or average lag across a topic. While useful at a glance, these aggregates can obscure issues in individual partitions or consumer instances. A single partition with sustained lag is often enough to increase end-to-end processing delay for dependent systems. Monitoring at the partition level is essential for accurate diagnosis.
Closing thoughts
Kafka consumer lag is a simple metric that carries a lot of operational context. Understanding what it represents, why it changes, and how to monitor it effectively can make the difference between reactive firefighting and proactive system management.
If you want to explore consumer lag monitoring with a dedicated Kafka UI, you can start free with Kpow Community Edition.
For how this fits the wider operational picture, see the complete guide to Kafka.