
Rapid Kafka Diagnostics: A Unified Workflow for Root Cause Analysis

Table of contents


Overview
In distributed systems, the biggest barrier to resolving incidents is rarely a lack of data. It is the Context Gap.
When a data pipeline stalls, operational signals are often fragmented. Infrastructure metrics like broker CPU are isolated in one dashboard, while application performance data like consumer lag resides in another. Engineers are forced to manually correlate these disconnected views, wasting critical minutes switching between terminals and monitoring platforms to piece together a coherent picture of the system.
Kpow eliminates this friction by providing a unified, real-time interface that bridges the gap between infrastructure, data, and consumers.
In this guide, we demonstrate exactly how Kpow closes the Context Gap. Using a real-world "Zombie Consumer" scenario, we walk through a streamlined diagnostic workflow that allows you to move from a vague symptom to a definitive root cause and resolution.
This is Part 1 of the Kafka Observability with Kpow: Driving Operational Excellence series. You can read the full strategy in the main series article and access the associated posts as they become available.
- Part 1: Rapid Kafka Diagnostics: A Unified Workflow for Root Cause Analysis (This article)
- Part 2: Beyond JMX: Supercharging Grafana Dashboards with High-Fidelity Metrics
- Part 3: Operational Transparency: Real-Time Audit Trail integrated with Webhooks
About Factor House
Factor House is a leader in real-time data tooling, empowering engineers with innovative solutions for Apache Kafka® and Apache Flink®.
Our flagship product, Kpow for Apache Kafka, is the market-leading enterprise solution for Kafka management and monitoring.
Start your free 30-day trial or explore our live multi-cluster demo environment to see Kpow in action.
.png)
Scenario: Silent Stall
Imagine you are managing an orders-fulfillment service consuming from an orders topic with three partitions.
The alert comes in from customer support. Some customers are complaining that their orders haven't been completed. It is not a total system outage. Most orders are flowing through and generating shipping labels, but a persistent number of requests seem to be vanishing into a black hole.
You immediately check your primary monitoring dashboard. The Kubernetes pod status is Running. The overall service throughput looks active. There are no critical alerts for broker failures or network outages. According to your infrastructure tools, the system is healthy.
In reality, a legacy upstream system has injected a "poison pill" message into the topic. Specifically, a JSON record where the amount field was sent as a string ("ONE THOUSAND DOLLARS") rather than the expected numeric representation. This schema mismatch has hit Partition 2. It caused that specific consumer thread to crash, catch the error, seek back to the problematic offset, and retry in an infinite loop.
Because other partitions are processing normally, the aggregated metrics mask the failure. To the Kafka broker, the stuck consumer looks alive because it is still sending heartbeats. To the customers whose orders landed on Partition 2, the service is dead.
Traditional Investigation: Fragmented Tools
Diagnosing this kind of partial failure usually forces you to piece together clues from multiple disconnected sources, wasting valuable time.
Infrastructure Check
Your first instinct is to check the infrastructure metrics in Datadog or Grafana. You look for CPU spikes or memory leaks, but you find nothing. Because the majority of the consumer instances are running without an issue, the aggregated metrics hide the single stuck instance. The failure is completely invisible at the infrastructure level.
Tooling Gap (Skipping the Producer)
Logically, your next step should be to verify the Producer: is data actually entering the system? However, native CLI tools like kafka-topics.sh provide configuration details, not real-time throughput. To check "messages per second" in the terminal requires hacky shell scripts or manual offset math. Because this is slow and painful, you are forced to skip the producer check entirely and jump straight to the consumer, leaving a critical blind spot in your diagnosis.
Consumer CLI Query
You switch context to kafka-consumer-groups.sh. The output shows the group state is Stable, which is technically true but misleading. However, looking closely at the partition list, you finally spot the anomaly: the LAG for Partition 2 is skyrocketing while the others remain near zero. You now know where the blockage is, but because the CLI cannot correlate this with live data, you have no clue what caused it.
Log Dive
Finally, you open Splunk or Elasticsearch to hunt for the root cause. You find a stream of Schema Mismatch exceptions intermingled with thousands of successful processing logs. You can see the error type, but application logs often redact sensitive payloads or fail to capture the specific offset context. You know the consumer is choking on specific data, but you cannot see the message causing the choke. You cannot fix data you cannot see.
Kpow Workflow: Unified Diagnostic Workflow
To address this, we replace the fragmented toolset with a unified workflow in Kpow. The following steps demonstrate how to troubleshoot the failure by tracing the path from the cluster down to the specific message. We then resolve the issue immediately, all within a single interface.
Step 1: Broker Metrics - Ruling Out Infrastructure
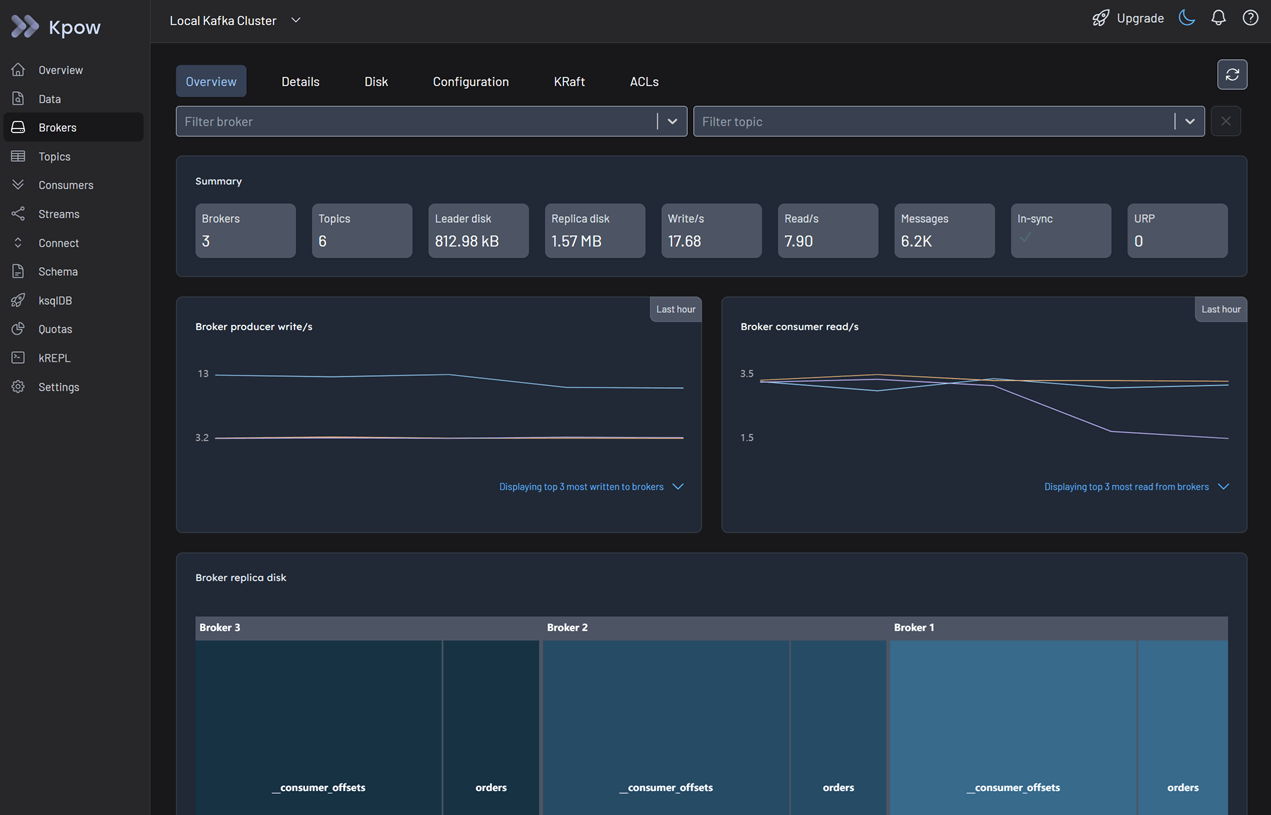
Log in to Kpow and navigate to the Brokers view.
Because only some orders are missing, it is unlikely that the brokers are the root cause. However, it is best practice to perform a quick health check to be certain.
In the Overview tab, review the summary statistics and metrics graphs. You can see that the cluster throughput is active and there are no indicators of under-replicated partitions. The brokers are running fine.
Step 2: Topic Exploration - Spotting Deviations
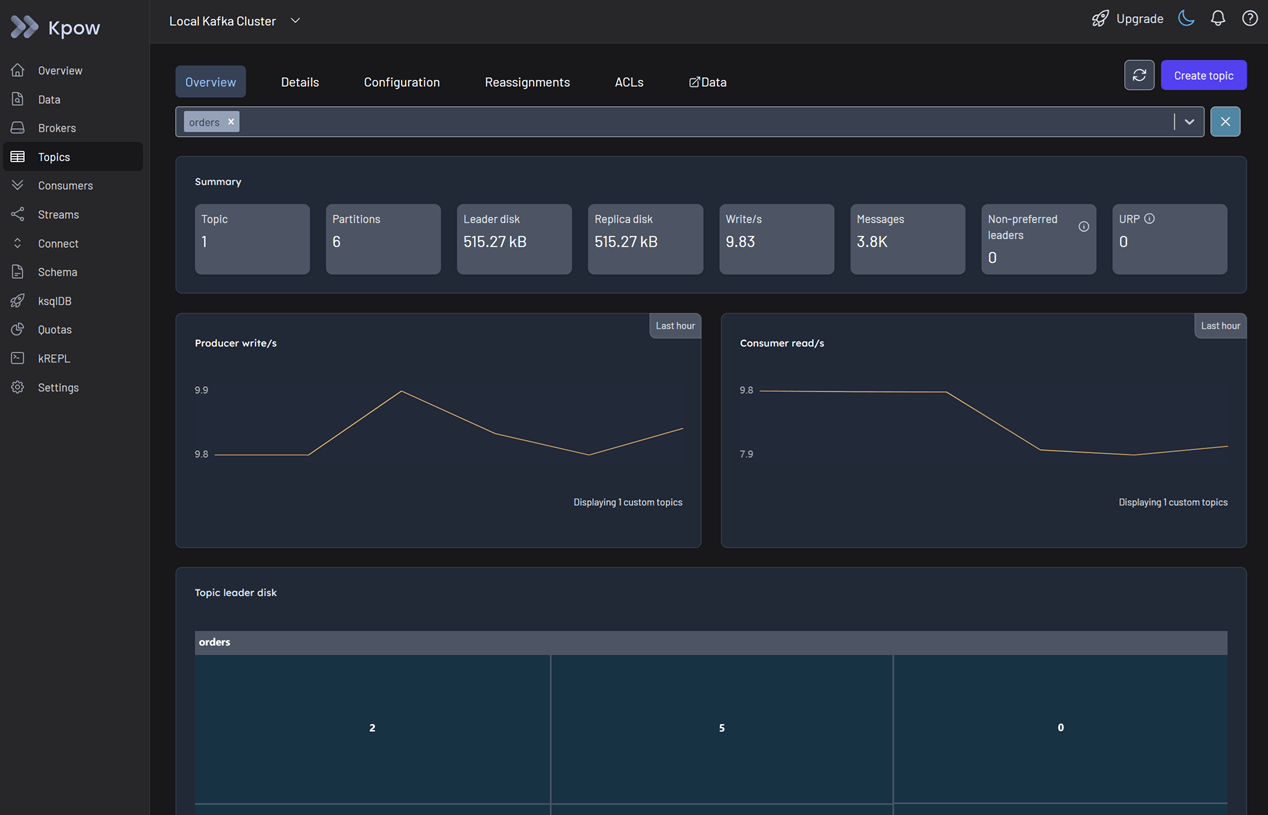
Navigate to the Topics menu.
In the Overview tab, select the orders topic. At first glance, there is no clear evidence of an issue based on the summary statistics and metrics. The aggregate data looks healthy, and it is because the majority of partitions are still processing traffic.
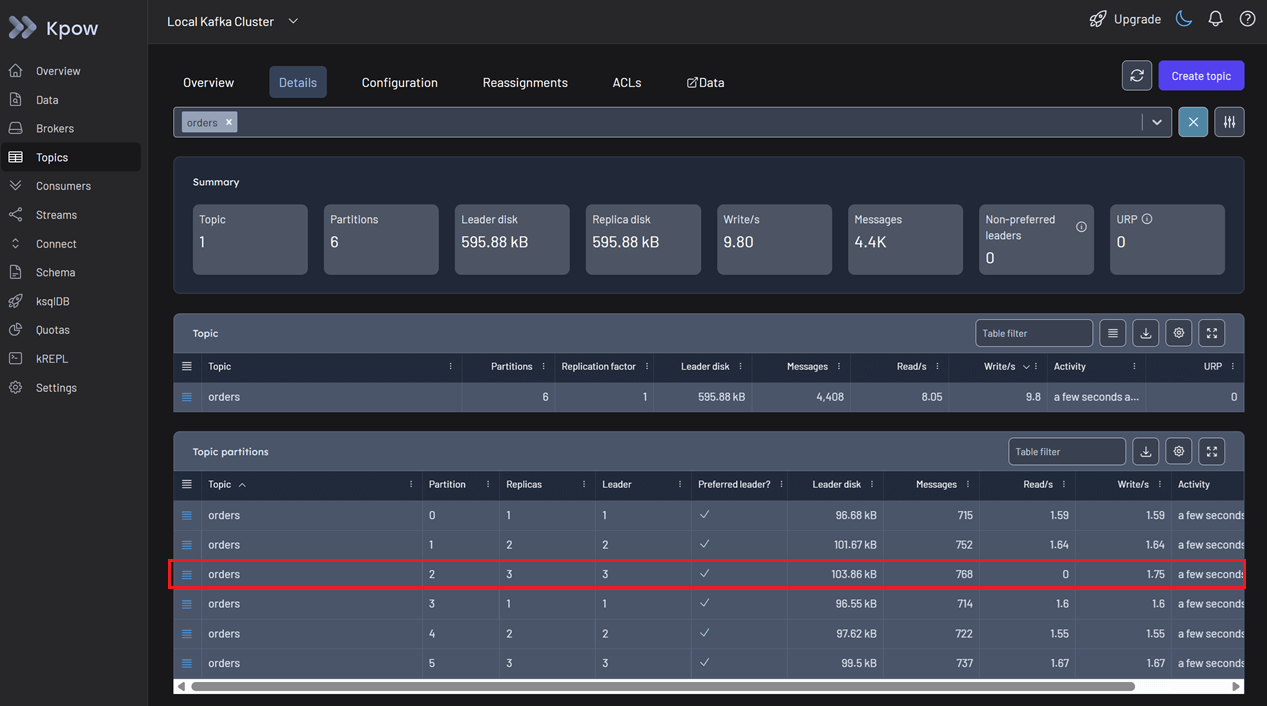
Switch to the Details tab to investigate further. Look at the topic partitions table. Here you identify the discrepancy immediately. In Partition 2, messages are being written continuously, but the read rate is zero. Traffic is entering the partition but nothing is leaving.
Step 3: Consumer Analysis - Identifying Root Cause
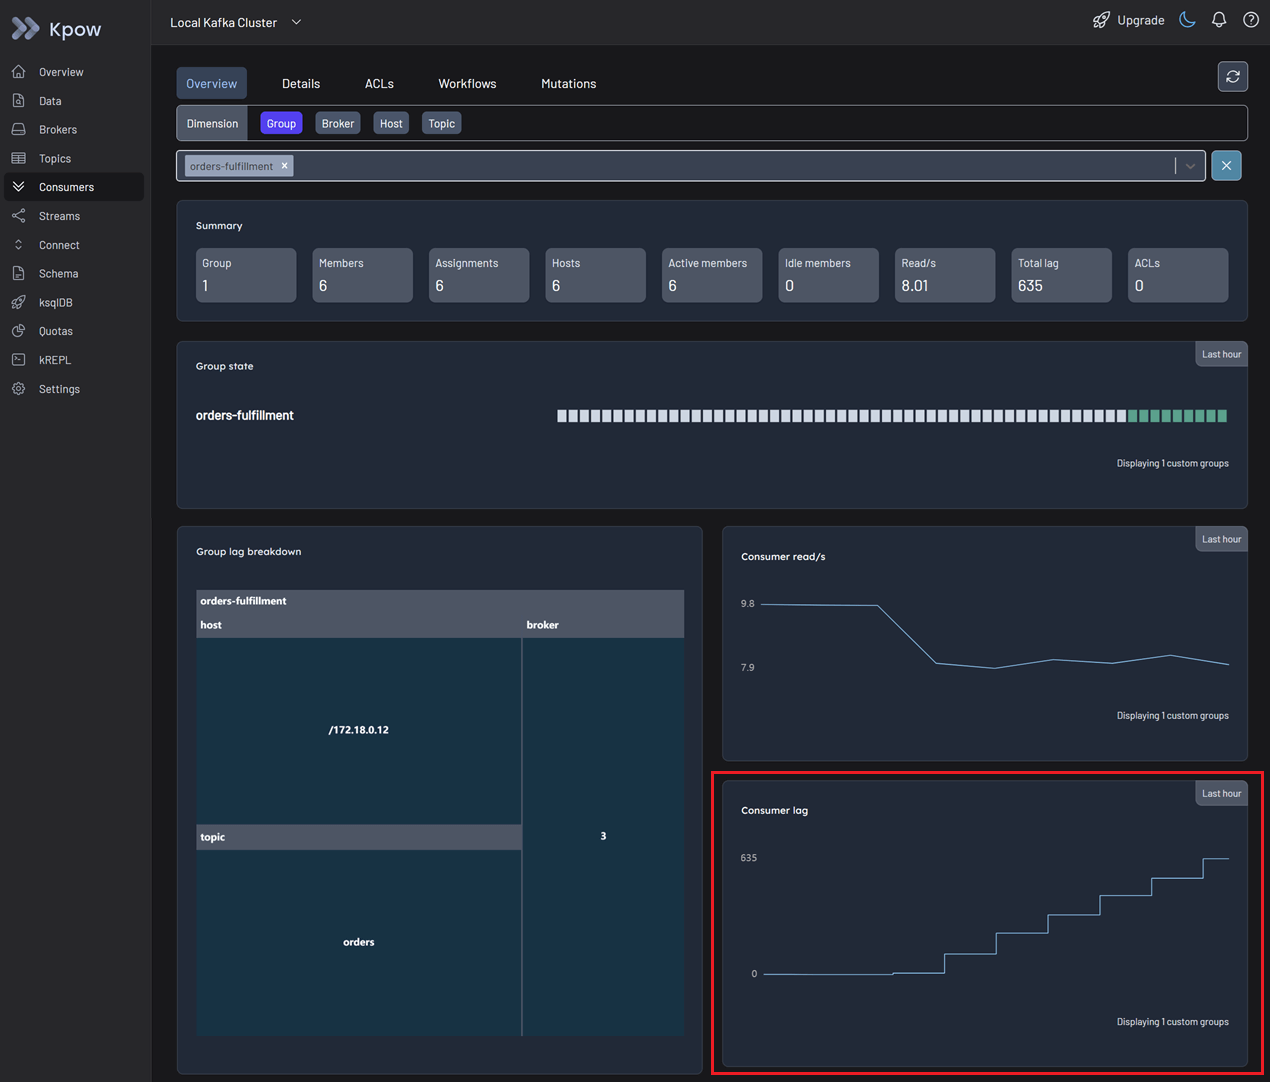
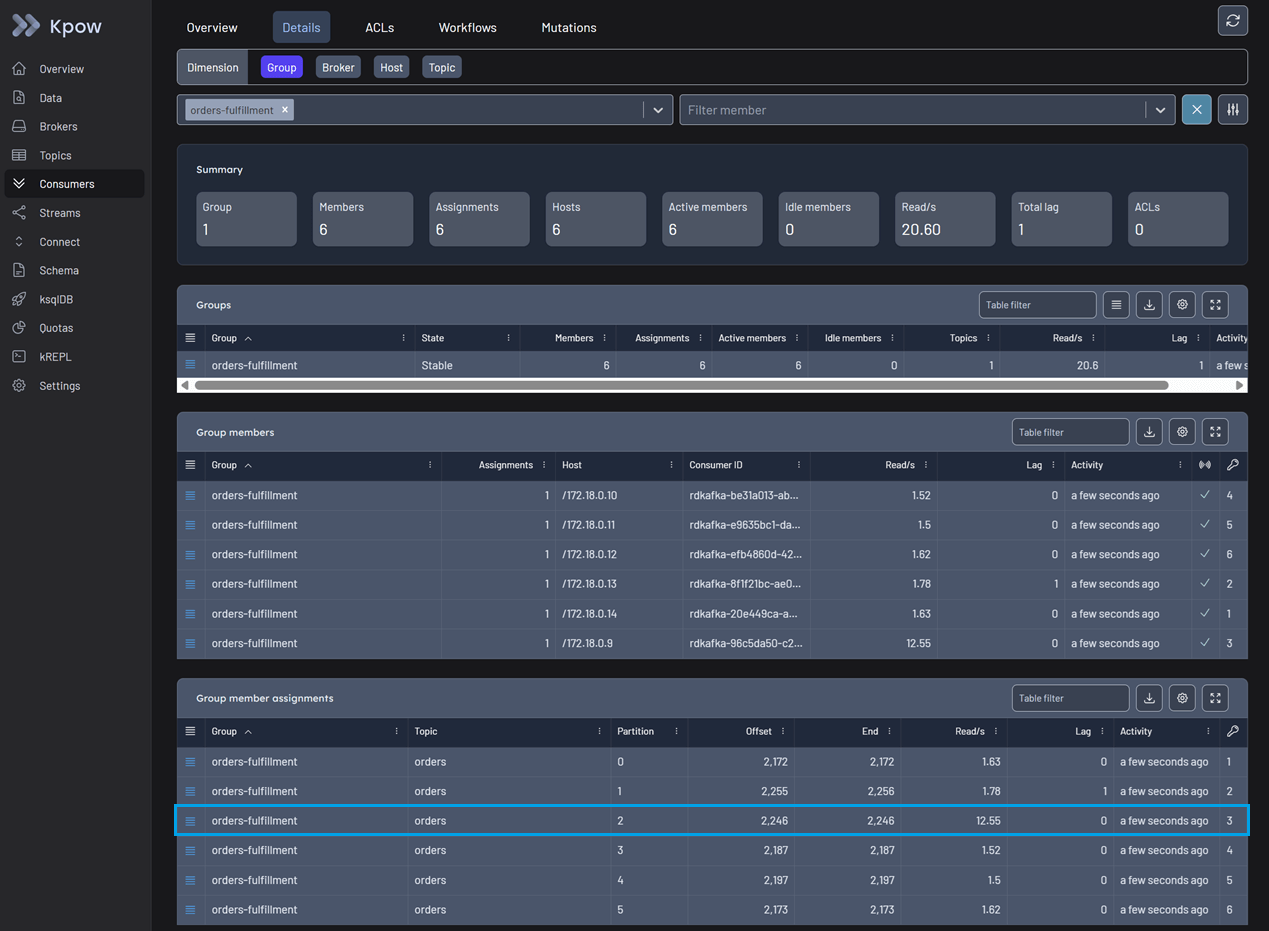
Navigate to the Consumers menu and select the relevant consumer group.
In the Overview tab, you can spot an issue immediately. The total consumer lag is increasing, even though no idle members are detected and messages continue to be consumed globally.
Switch to the Details tab for a granular view. You can now see that one specific group member is stuck on a particular offset. It is not reading any new data, and the lag for that specific partition is accumulating rapidly. To confirm what is blocking the pipeline, use the action menu on the right and select Inspect data.
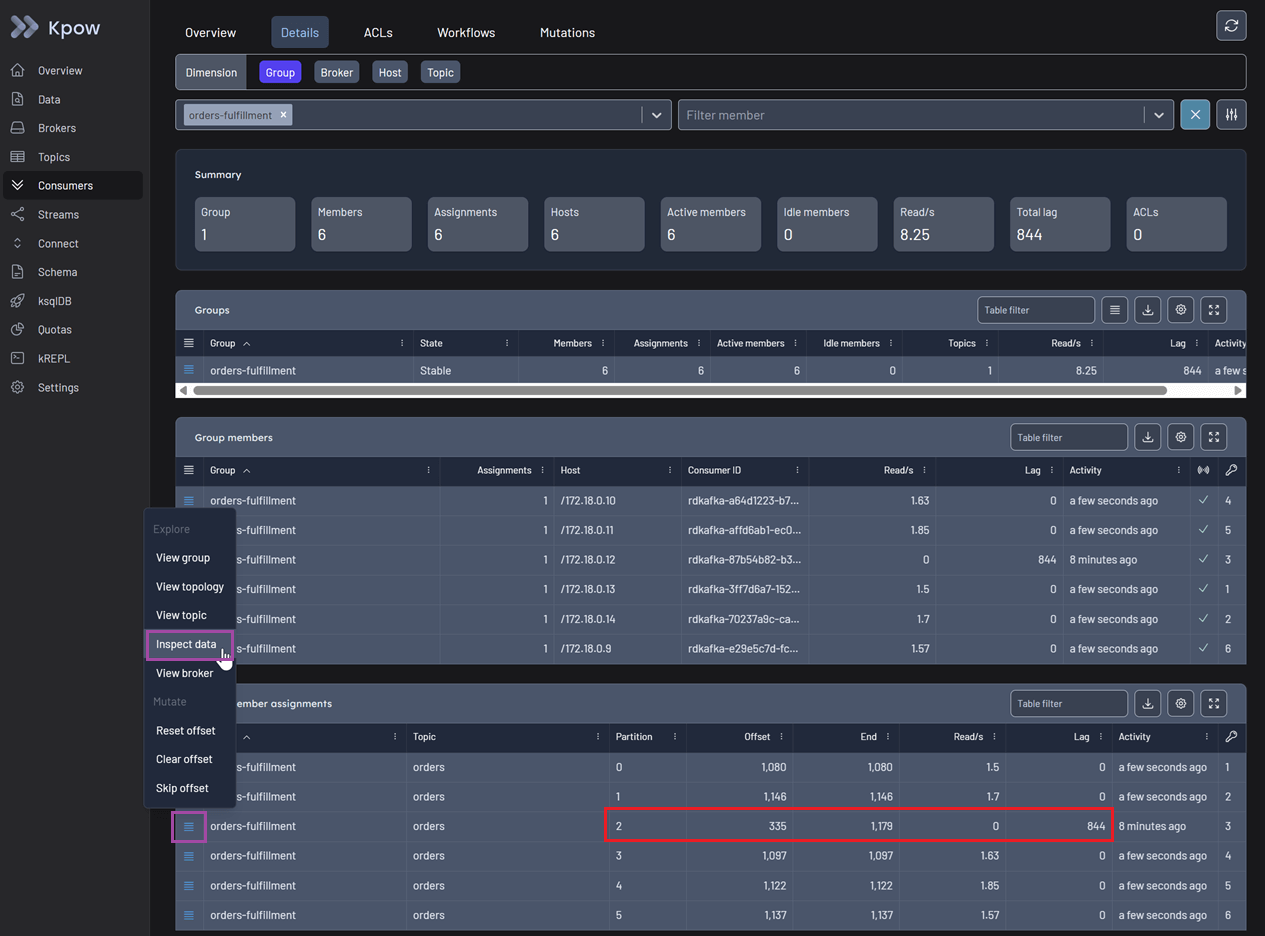
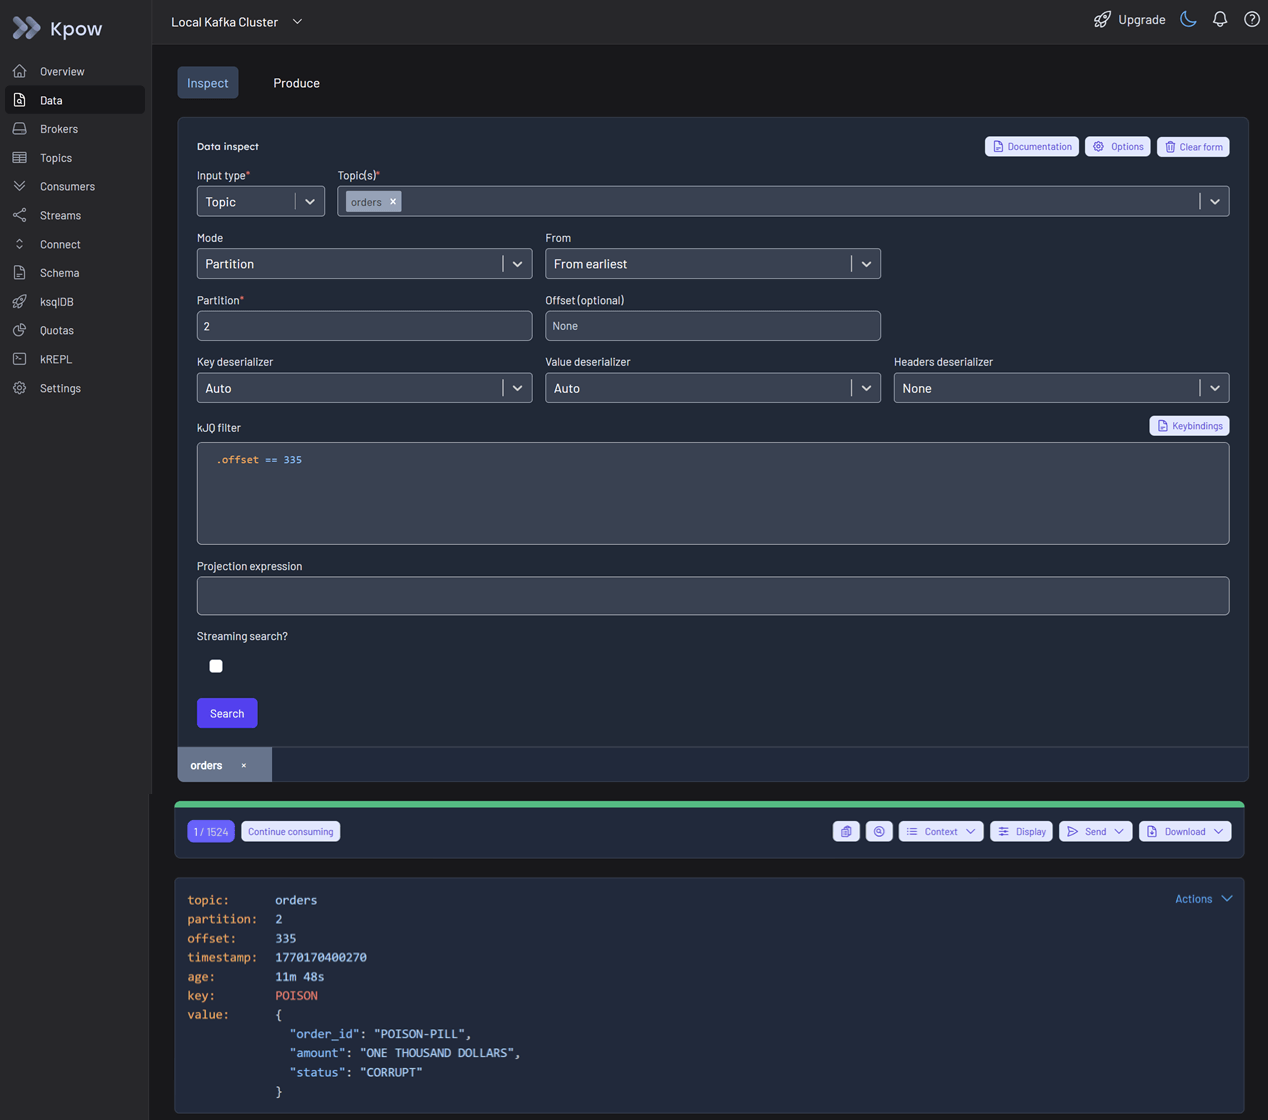
This opens the Data inspect view with the affected topic partition pre-selected. You can use kJQ to filter the specific offset under investigation. By clicking the search button, you can confirm that the message value is malformed, causing the application logic to crash on this record.
Step 4: Resolution - Executing Staged Mutations
Now that the poison pill is identified, you need to unblock the partition.
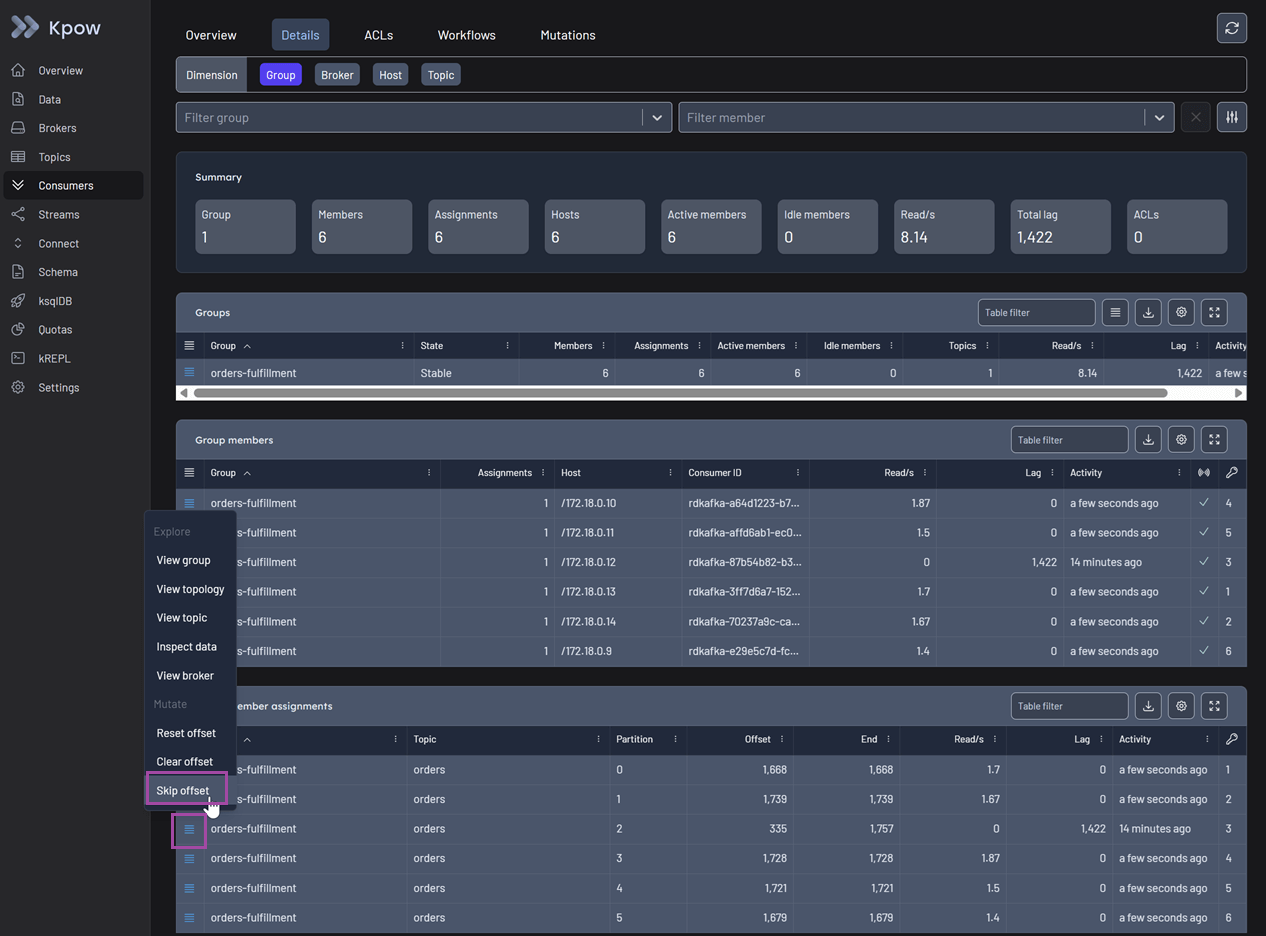
Go back to the Consumers menu. In the action menu for the stuck group member, select Skip offset.
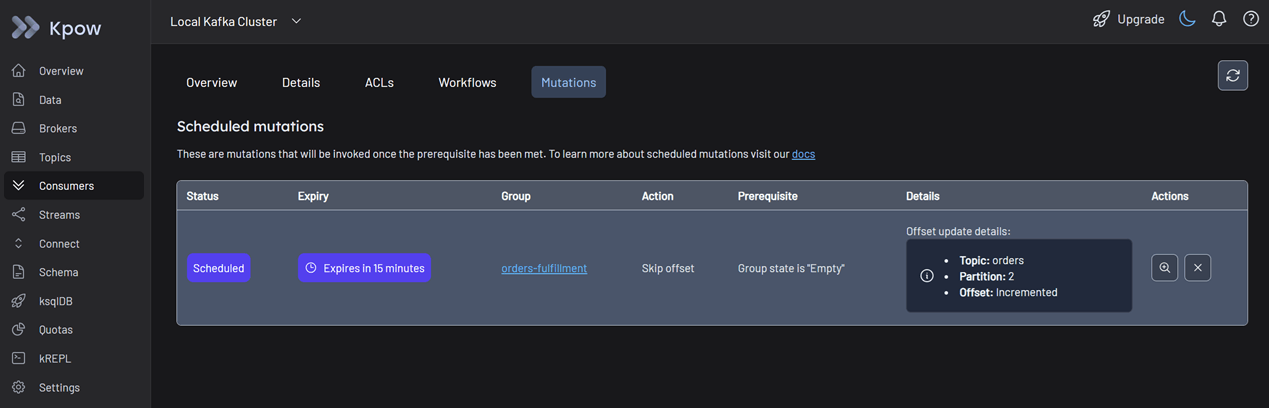
This action initiates a Staged Mutation, and its status is marked as Scheduled. Note that, for Kpow to safely apply this offset change, the consumer group status must be Empty to prevent state conflicts.
Stop your consumer application instances. Kpow detects that the group has stopped and automatically applies the staged mutation.
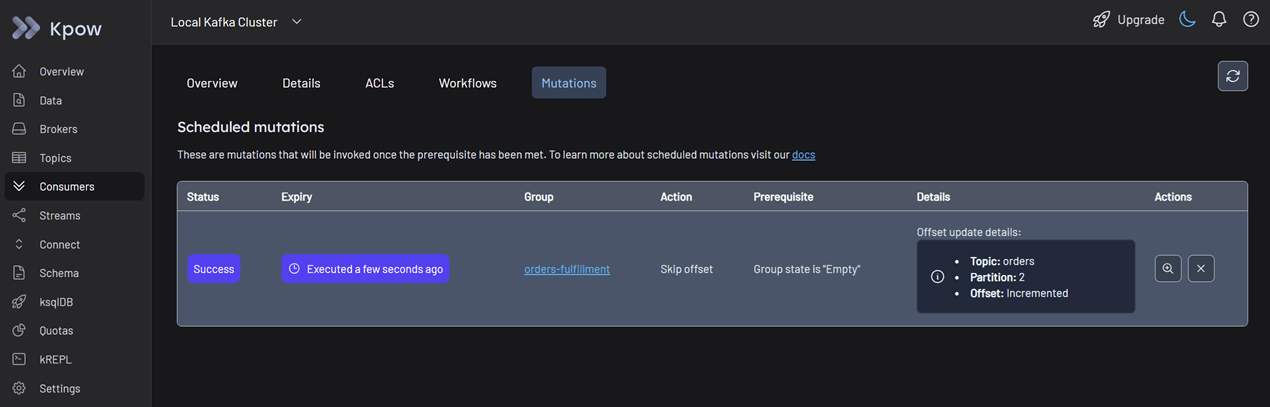
Once the mutation status shows as succeeded, restart your consumer application. You can now see the consumers reading from all partitions as usual. The stuck lag drains immediately, and the missing orders begin to process.
Conclusion
In the "Silent Stall" scenario, we saw that relying on fragmented tools creates a critical context gap, forcing engineers to waste time manually correlating logs, metrics, and CLI output.
Kpow solves this with a unified workflow. By integrating consumer lag, data inspection, and resolution tools into a single interface, we transformed a complex investigation into a linear path. We didn't just identify the poison pill; we resolved it immediately using Staged Mutations without leaving the platform.
In Part 2: Beyond JMX, we will show you how to close the Quality Gap by feeding high-fidelity Kafka metrics directly into your Grafana dashboards.
Next steps
Explore Kpow in your own environment with a free 30-day trial.
If you need assistance managing your Kafka environment, reach out to our engineering support team at support@factorhouse.io.