Best tools to monitor Kafka broker health
ComparisonsThe best tools to monitor Kafka broker health fall into three groups: the open-source standard of Prometheus scraping broker JMX metrics through the JMX Exporter and graphing them in Grafana, dedicated Kafka consoles such as Kpow and Confluent Control Center, and commercial APM platforms such as Datadog and New Relic. No single tool sees every broker signal. JMX-based tools see request latency and the JVM, and Admin API tools see cluster-wide replication state without an agent on every broker.
Broker health is whether each broker is serving its partitions, keeping its replicas in sync and handling requests in time. This page is narrowly about brokers: in-sync replicas, under-replicated and offline partitions, the controller, request latency, disk and the JVM. For consumer lag, the comparison of consumer lag monitoring tools covers that job, the broader list of Kafka monitoring tools covers the wider field, and the complete Kafka guide has the full cluster picture.
At a glance
Six options are scored here on this page's six weighted criteria, 80 points in all. The rubric is weighted: Accuracy when brokers are down counts three times, and Signal coverage, Collection method and overhead, Granularity and cardinality, Alerting and history and Time to a useful view count once. The five listed first, of six, each out of 80: Kpow 64, which takes its best score on Accuracy when brokers are down (10 out of 10) and its lowest on Signal coverage (5 out of 10); Commercial APM: Datadog and New Relic 57; The DIY and open-source standard: Prometheus, JMX Exporter and Grafana 56; Kafka API exporters: kafka_exporter and KMinion 52; Cruise Control 48.
What they actually want from a broker health tool
The signals are well defined. The Apache Kafka monitoring documentation lists the metrics that matter for a broker and the value each should hold in steady state:
kafka.server:type=ReplicaManager,name=UnderReplicatedPartitions      0
kafka.server:type=ReplicaManager,name=UnderMinIsrPartitionCount      0
kafka.controller:type=KafkaController,name=OfflinePartitionsCount    0
kafka.controller:type=KafkaController,name=ActiveControllerCount     1 on exactly one node
kafka.server:type=ReplicaManager,name=IsrShrinksPerSec               0 outside broker restarts
kafka.server:type=KafkaRequestHandlerPool,name=RequestHandlerAvgIdlePercent   ideally > 0.3
kafka.network:type=SocketServer,name=NetworkProcessorAvgIdlePercent           ideally > 0.3
kafka.log:type=LogManager,name=OfflineLogDirectoryCount              0
Request latency comes from kafka.network:type=RequestMetrics,name=TotalTimeMs per request type, broken into queue, local, remote and response time. On KRaft clusters the controller adds FencedBrokerCount and ActiveBrokerCount. What each of these means, how to alert on it and which thresholds to use is covered in Kafka broker monitoring. This page is about which tools collect them, and what each tool cannot see.
Chad Harris’s take: In one incident I describe in my talk on Kafka operational issues, one broker was sitting at 100% CPU and all of the other brokers were fine, and the reaction was that we needed more Kafka. When you add brokers, partitions start moving to them, partition reassignments drive more rebalance activity, and that means more load on the group coordinator, which was the broker already at 100%. We poured more fuel onto the fire. Scaling the thing that isn’t broken doesn’t fix the thing that is, and can make it more broken. The missing signals were consumer group membership size and coordinator request rates, and nothing in our dashboards pointed at them.
The tools compared
Every row uses the same fields in the same order. The Source column points at each tool’s own documentation.
| Rank | Tool | Signal coverage | Accuracy when brokers are down | Collection method and overhead | Granularity | Alerting and history | Time to a useful view | Source |
|---|---|---|---|---|---|---|---|---|
| 1 | Kpow | Partial. Under-replicated partitions, controller ID, KRaft quorum voters, observers and leader epoch, preferred-leader percentages, and disk per broker, directory and topic. No request latency, thread idle ratios or broker JVM metrics, because Kpow does not read JMX. | Strong. The URP count iterates every topic partition, so it stays correct when a broker is offline and missing from the AdminClient’s view. | One container with a client connection, snapshotting each cluster on a regular cycle. Nothing installed on brokers. | Per broker and per topic in Prometheus, with offsets per partition. | Prometheus endpoints for Alertmanager, Grafana or New Relic, plus history in the UI. | Fast. Signals (Alpha, Enterprise, opt-in) adds opinionated checks for offline leaders and replicas, under-replicated partitions, leader skew and data skew. | Kpow Prometheus docs |
| 2 | Datadog Kafka integration | Strong. Broker metrics from JMX through the Datadog Agent. | Good. Same JMX model as Prometheus. | The Agent’s JMXFetch on each broker node, with a documented limit of 350 metrics per instance. Not usable with Amazon MSK, which has a separate integration. | Configurable. | Strong. Commercial monitors and dashboards. | Fast. Prebuilt dashboards. | Datadog’s documentation, “Kafka Broker” integration page |
| 3 | New Relic Kafka integration | Strong. Broker metrics from JMX. | Good. Same JMX model. | Requires JMX enabled on all brokers, and fewer than 10,000 monitored topics. | Configurable. | Strong. Commercial alerting. | Fast. Prebuilt dashboards. | New Relic Kafka integration |
| 4 | Prometheus + JMX Exporter + Grafana | Strong. Every broker MBean you configure, including request latency, thread idle ratios, ISR churn and JVM. | Good. The active controller and surviving brokers keep reporting when one broker dies, but the dead broker’s own series stop. | JMX Exporter as a Java agent in each broker JVM, or standalone. | As fine as your scrape rules, including per partition. | Strong. Prometheus storage and Alertmanager. | Slow. Dashboards and rules are yours to build and maintain. | JMX Exporter docs |
| 5 | kafka_exporter | Partial. Broker count, per-partition ISR count, leader, preferred-leader status and under-replicated flag, plus consumer group lag. No latency or JVM. | Good. Computed from cluster metadata. | One exporter with a Kafka client connection. | Per partition. | Through Prometheus. | Medium. Fewer metrics to wire up. | kafka_exporter |
| 6 | KMinion | Partial. Broker info including controller and rack, log directory sizes by broker or topic, consumer lag, and end-to-end produce and consume latency measured from its own test messages. | Good. Uses the Kafka API. | One exporter with a Kafka client connection. | Configurable per partition or per topic. | Through Prometheus. | Medium. | KMinion |
| 7 | Cruise Control | Partial. Cluster state including offline partitions, out-of-sync replicas, replicas under min.insync.replicas and offline log directories, plus broker resource use. |
Good. Anomaly detection for broker failure, disk failure and slow brokers. | A separate service plus a metrics reporter JAR on every broker. | Per broker and per partition. | Anomaly notifier, with self-healing off by default. | Slow. Built for rebalancing, with monitoring as a side benefit. | Cruise Control |
| 8 | Confluent Control Center | Strong for Confluent Platform. A Brokers overview with partitioning and replication, active controller, disk and system panels, and per-broker metrics. | Not documented on the Brokers page. | Part of Confluent Platform. Some panels are hidden in its reduced infrastructure mode. | Per broker. | Part of the Confluent Platform stack. | Fast on Confluent Platform. | Confluent’s documentation, “Manage Kafka Brokers Using Control Center for Confluent Platform” |
Scoring notes. For request latency and the broker JVM, a JMX-based tool is required, and Prometheus with the JMX Exporter is the strongest free option. Kpow cannot replace it for those signals. Kpow is strongest on cluster-wide replication state that stays correct during a broker outage, the KRaft quorum view, and getting there without installing anything on the brokers.
Kpow live demo
Check broker health from outside the brokers
Explore Kpow's Brokers page in the demo: under-replicated partitions, the controller and disk per broker, with nothing installed on the brokers.
For SRE and platform teams running production Kafka.
Try the Kpow demoEach option in detail
 Rank 1
 Kpow
64 out of 80 Total
Try Kpow in the live demo No signup needed.
- Type
- Kafka console
- Reads JMX
- No
- Signals
- Alpha, Enterprise, opt-in
- Signal coverage
- 5 out of 10
- Accuracy when brokers are down ×3 weight, this criterion counts 3 times toward the total
- 10 out of 10
- Collection method and overhead
- 8 out of 10
- Granularity and cardinality
- 6 out of 10
- Alerting and history
- 7 out of 10
- Time to a useful view
- 8 out of 10
Why these scores for Kpow
- Signal coverage 5 out of 10
- It is “Partial”, with URP, controller, KRaft quorum, preferred leaders and disk, but “No request latency, thread idle ratios or broker JVM metrics, because Kpow does not read JMX”, and the page’s summary adds “Kpow cannot replace it for those signals.”
- Accuracy when brokers are down 10 out of 10
- Accuracy is “Strong”, since the URP count iterates every topic partition and stays correct when a broker is offline, and the page’s summary calls it strongest here.
- Collection method and overhead 8 out of 10
- It runs as one container with a client connection and nothing installed on brokers, and the quote under criterion 3 has it computing telemetry from snapshots, so it samples rather than streams, the same pass as the Kafka API exporters.
- Granularity and cardinality 6 out of 10
- It reports per broker and per topic in Prometheus, with offsets per partition, and criterion 4 notes its partition-level metrics sit behind a flag. The exporters and the JMX stack go finer.
- Alerting and history 7 out of 10
- It has Prometheus endpoints for Alertmanager, Grafana or New Relic, plus history in the UI, one step above the exporters and below the JMX stack and APM.
- Time to a useful view 8 out of 10
- Speed is “Fast”, and Signals adds opinionated checks, but it is Alpha, Enterprise-only and opt-in.
What it is. It shows under-replicated partition totals on its Brokers and Topics pages with a table of affected topics, the KRaft quorum’s voters and observers, and disk usage per broker and topic, and it exports these to Prometheus as metrics such as broker_urp, cluster_controller, kraft_voter_count, kraft_leader_epoch and broker_bytes_disk. Signals, an opt-in Alpha feature for Kpow Enterprise added in 96.3, runs opinionated checks with a health score and an issues list, including offline leaders, offline replicas, under-replicated partitions, topics below a minimum replication factor, and brokers with a disproportionate share of leadership or data. It is off by default and its documentation notes it may add overhead on large clusters. The leader and data skew checks map to the imbalance walked through in the guide to diagnosing an unbalanced Kafka cluster.
Where it falls short. It does not read JMX, so request latency, thread idle ratios and broker GC are not in it. Disk figures depend on the provider exposing broker log directory data, and some managed services, such as Confluent Cloud, do not. Run it alongside a JMX pipeline, not instead of one.
Staying patched. Kpow’s release notes name the CVEs each release remediates, and the 96.4 image built on 5 August 2026 bundles 311 dependencies. What a licence buys here is not a different deployment model, because Kpow is self-hosted too. It is a company contracted to ship the fix. Every dependency figure on this page was read on 24 September 2026 from the published artefacts and from nvd.nist.gov.
Compare Kpow vs Confluent Control Center
Commercial APM: Datadog and New Relic
datadoghq.com, newrelic.com
57 out of 80 Total
- Covers
- Datadog, New Relic
- Collection
- Agent reading broker JMX
- Signal coverage
- 9 out of 10
- Accuracy when brokers are down ×3 weight, this criterion counts 3 times toward the total
- 7 out of 10
- Collection method and overhead
- 4 out of 10
- Granularity and cardinality
- 7 out of 10
- Alerting and history
- 8 out of 10
- Time to a useful view
- 8 out of 10
Why these scores for Commercial APM: Datadog and New Relic
- Signal coverage 9 out of 10
- Both are “Strong. Broker metrics from JMX”, putting broker metrics next to host, JVM and traces, below the JMX Exporter, which the page calls complete.
- Accuracy when brokers are down 7 out of 10
- Accuracy is “Good. Same JMX model as Prometheus”, so the same dead-broker caveat applies.
- Collection method and overhead 4 out of 10
- Datadog puts agent JMXFetch on each broker node with a 350-metric limit and is not usable with Amazon MSK, and New Relic needs JMX on all brokers and under 10,000 topics.
- Granularity and cardinality 7 out of 10
- Granularity is “Configurable”, though “the metric caps above matter on large clusters”.
- Alerting and history 8 out of 10
- Datadog is “Strong. Commercial monitors and dashboards” and New Relic is “Strong. Commercial alerting”.
- Time to a useful view 8 out of 10
- Both are “Fast. Prebuilt dashboards”.
What they are. Agent-based monitoring platforms with Kafka integrations. Datadog’s documentation says its Kafka check collects broker metrics from JMX through JMXFetch, has a limit of 350 metrics per instance, and cannot be used with Amazon MSK, which has its own integration. The New Relic Kafka integration requires JMX enabled on all brokers and fewer than 10,000 monitored topics.
Where they win. Broker metrics next to host, JVM and application traces in a system your company may already pay for, with prebuilt dashboards.
Where they fall short. Cost scales with hosts and metric volume, and the metric caps above matter on large clusters.
 Rank 3
 The DIY and open-source standard: Prometheus, JMX Exporter and Grafana
56 out of 80 Total
- Type
- Open-source stack
- Collection
- Java agent in each broker JVM
- Signal coverage
- 10 out of 10
- Accuracy when brokers are down ×3 weight, this criterion counts 3 times toward the total
- 7 out of 10
- Collection method and overhead
- 5 out of 10
- Granularity and cardinality
- 9 out of 10
- Alerting and history
- 8 out of 10
- Time to a useful view
- 3 out of 10
Why these scores for The DIY and open-source standard: Prometheus, JMX Exporter and Grafana
- Signal coverage 10 out of 10
- Coverage is “Strong. Every broker MBean you configure, including request latency, thread idle ratios, ISR churn and JVM”, and the page’s own prose calls it “Complete coverage” and “the only free way” to get latency percentiles and broker GC.
- Accuracy when brokers are down 7 out of 10
- It is “Good”, with the caveat that the dead broker’s own series stop.
- Collection method and overhead 5 out of 10
- The JMX Exporter runs as a Java agent in each broker JVM, remote JMX must be secured, and Apache ships it with authentication disabled.
- Granularity and cardinality 9 out of 10
- Granularity is “As fine as your scrape rules, including per partition”, which is the “full control over granularity” that criterion 4 asks for.
- Alerting and history 8 out of 10
- Alerting is “Strong. Prometheus storage and Alertmanager.”
- Time to a useful view 3 out of 10
- It is “Slow. Dashboards and rules are yours to build and maintain.”
What it is. The JMX Exporter collects JMX MBean values and exposes them as Prometheus metrics, usually as a Java agent inside each broker JVM. Prometheus stores them and Grafana draws the dashboards.
Where it wins. Complete coverage of what the broker exposes, full control over granularity, and no license cost. It is the only free way to get request latency percentiles and broker GC into the same system as everything else.
Where it falls short. You own the scrape rules, the dashboards and the alerts, and they need maintaining as Kafka versions and metric names change. Remote JMX must be secured, since Apache ships it with authentication disabled.
Staying patched. The Prometheus JMX Exporter is Apache-2.0 with a published security policy, six releases in two years and no CVE filed against its own code. It runs as an agent inside the broker, so its version is part of the broker’s attack surface rather than beside it.
Kafka API exporters: kafka_exporter and KMinion
github.com/danielqsj/kafka_exporter, github.com/redpanda-data/kminion
52 out of 80 Total
- Type
- Prometheus exporters
- Reads
- Kafka protocol, not JMX
- Signal coverage
- 4 out of 10
- Accuracy when brokers are down ×3 weight, this criterion counts 3 times toward the total
- 7 out of 10
- Collection method and overhead
- 8 out of 10
- Granularity and cardinality
- 8 out of 10
- Alerting and history
- 6 out of 10
- Time to a useful view
- 5 out of 10
Why these scores for Kafka API exporters: kafka_exporter and KMinion
- Signal coverage 4 out of 10
- Both are “Partial”, since “Neither sees broker request internals or the JVM”, and kafka_exporter reports no disk while KMinion adds log directory sizes and client-side end-to-end latency.
- Accuracy when brokers are down 7 out of 10
- Accuracy is “Good. Computed from cluster metadata” for kafka_exporter and “Good. Uses the Kafka API” for KMinion.
- Collection method and overhead 8 out of 10
- One exporter holds a Kafka client connection and no agent goes on the brokers, and under criterion 3 Admin API tools sample rather than stream.
- Granularity and cardinality 8 out of 10
- Metrics come per partition for kafka_exporter, and KMinion is configurable per partition or per topic.
- Alerting and history 6 out of 10
- Alerting for both is “Through Prometheus”, and the page names no history or alerting of their own.
- Time to a useful view 5 out of 10
- Speed is “Medium. Fewer metrics to wire up” for kafka_exporter and “Medium” for KMinion.
What they are. Exporters that read cluster state over the Kafka protocol rather than JMX. kafka_exporter exposes per-partition ISR counts, leaders, preferred-leader status and under-replicated flags. KMinion exposes broker info, log directory sizes and consumer lag, and adds end-to-end monitoring that produces and consumes its own messages to measure round-trip latency.
Where they win. No agent on the brokers, and replication state computed from metadata. KMinion’s end-to-end check measures latency the way a client experiences it, which catches problems a broker metric can miss.
Where they fall short. Neither sees broker request internals or the JVM.
Staying patched. kafka_exporter is Apache-2.0 with no CVE filed against its own code, but only two releases in twenty-four months, the most recent v1.10.0 in September 2026. KMinion is MIT and released v2.3.6 in September 2026. Neither comes with anybody contracted to patch it, so a dependency advisory in either reaches your cluster when you rebuild the image, on your own schedule.
Cruise Control
48 out of 80 Total
- Type
- Rebalancer
- Self-healing
- Off by default
- Signal coverage
- 5 out of 10
- Accuracy when brokers are down ×3 weight, this criterion counts 3 times toward the total
- 8 out of 10
- Collection method and overhead
- 3 out of 10
- Granularity and cardinality
- 8 out of 10
- Alerting and history
- 5 out of 10
- Time to a useful view
- 3 out of 10
Why these scores for Cruise Control
- Signal coverage 5 out of 10
- Coverage is “Partial”, with offline partitions, out-of-sync replicas, replicas under min.insync.replicas, offline log directories and broker resource use, which is “a subset of what the JMX stack gives you”.
- Accuracy when brokers are down 8 out of 10
- It is “Good. Anomaly detection for broker failure, disk failure and slow brokers”, and its win is slow broker and disk failure detection.
- Collection method and overhead 3 out of 10
- It needs a separate service plus a metrics reporter JAR on every broker, so running it only for monitoring means operating both.
- Granularity and cardinality 8 out of 10
- Granularity goes per broker and per partition.
- Alerting and history 5 out of 10
- Its anomaly notifier is there with self-healing off by default, and the page describes no history store.
- Time to a useful view 3 out of 10
- Speed is “Slow. Built for rebalancing, with monitoring as a side benefit.”
What it is. A rebalancer whose README also lists cluster state queries, covering online and offline partitions, in-sync and out-of-sync replicas and replicas under min.insync.replicas, and anomaly detection for broker failures, disk failures, metric anomalies and slow brokers.
Where it wins. Slow broker and disk failure detection tied directly to the tool that can move load away.
Where it falls short. It is a rebalancing service first. Running it only for monitoring means operating a service and a broker-side metrics reporter for a subset of what the JMX stack gives you.
Staying patched. Cruise Control is Apache-2.0 and actively maintained: twelve releases in two years, a published security policy, and no CVE filed against its own code. The gap to plan for is cadence rather than disclosure. It went 209 days between November 2025 and May 2026, and a fix to a bundled library reaches you only when the next release carries it, because nobody is contracted to cut one for you.
Confluent Control Center
confluent.io
37 out of 80 Total
- Type
- Kafka console
- Scope
- Confluent Platform
- Signal coverage
- 7 out of 10
- Accuracy when brokers are down ×3 weight, this criterion counts 3 times toward the total
- 3 out of 10
- Collection method and overhead
- 5 out of 10
- Granularity and cardinality
- 5 out of 10
- Alerting and history
- 4 out of 10
- Time to a useful view
- 7 out of 10
Why these scores for Confluent Control Center
- Signal coverage 7 out of 10
- Coverage is “Strong for Confluent Platform”, with a brokers overview, active controller, disk and system panels and per-broker metrics, though some panels are hidden in reduced infrastructure mode.
- Accuracy when brokers are down 3 out of 10
- It is “Not documented on the Brokers page”, so the page gives no evidence either way.
- Collection method and overhead 5 out of 10
- It is part of Confluent Platform, so nothing extra runs on that platform, but it is tied to it, and some panels are hidden in reduced infrastructure mode.
- Granularity and cardinality 5 out of 10
- Granularity is “Per broker” only, and per-broker is the minimum under criterion 4.
- Alerting and history 4 out of 10
- Alerting is “Part of the Confluent Platform stack”, and the page names no specific alerting or history.
- Time to a useful view 7 out of 10
- It is “Fast on Confluent Platform”, where the page’s own prose puts “Control Center first”, and it is limited to that platform.
What they are. Consoles that show broker health next to topic, consumer and cluster management. Confluent’s documentation describes Control Center’s Brokers overview as a way to assess broker health and drill into broker metrics, for Confluent Platform clusters.
Compare Kpow vs Confluent Control CenterConfluent Control Center review
How Factor House approaches broker health
Factor House built Kpow to answer the replication and cluster-state half of broker health from outside the brokers, so it keeps working when some of them do not. That is why the under-replicated partition count is calculated per topic partition, and why Signals checks for offline leaders and replicas rather than waiting for a broker to report on itself. Everything Kpow shows is also available through its Prometheus endpoints, so it adds to an existing Grafana and Alertmanager setup rather than competing with it. The guide to alerting with Kpow, Prometheus and Alertmanager walks through the rules, and the Kpow metrics glossary lists every metric. To check the replication and cluster-state half against your own criteria, open the Kpow demo and look at the Brokers page on a live cluster: under-replicated partition totals, the controller and disk per broker, the signals this page scores Kpow on.
For request latency and the JVM, Factor House recommends the JMX Exporter or your existing APM agent.
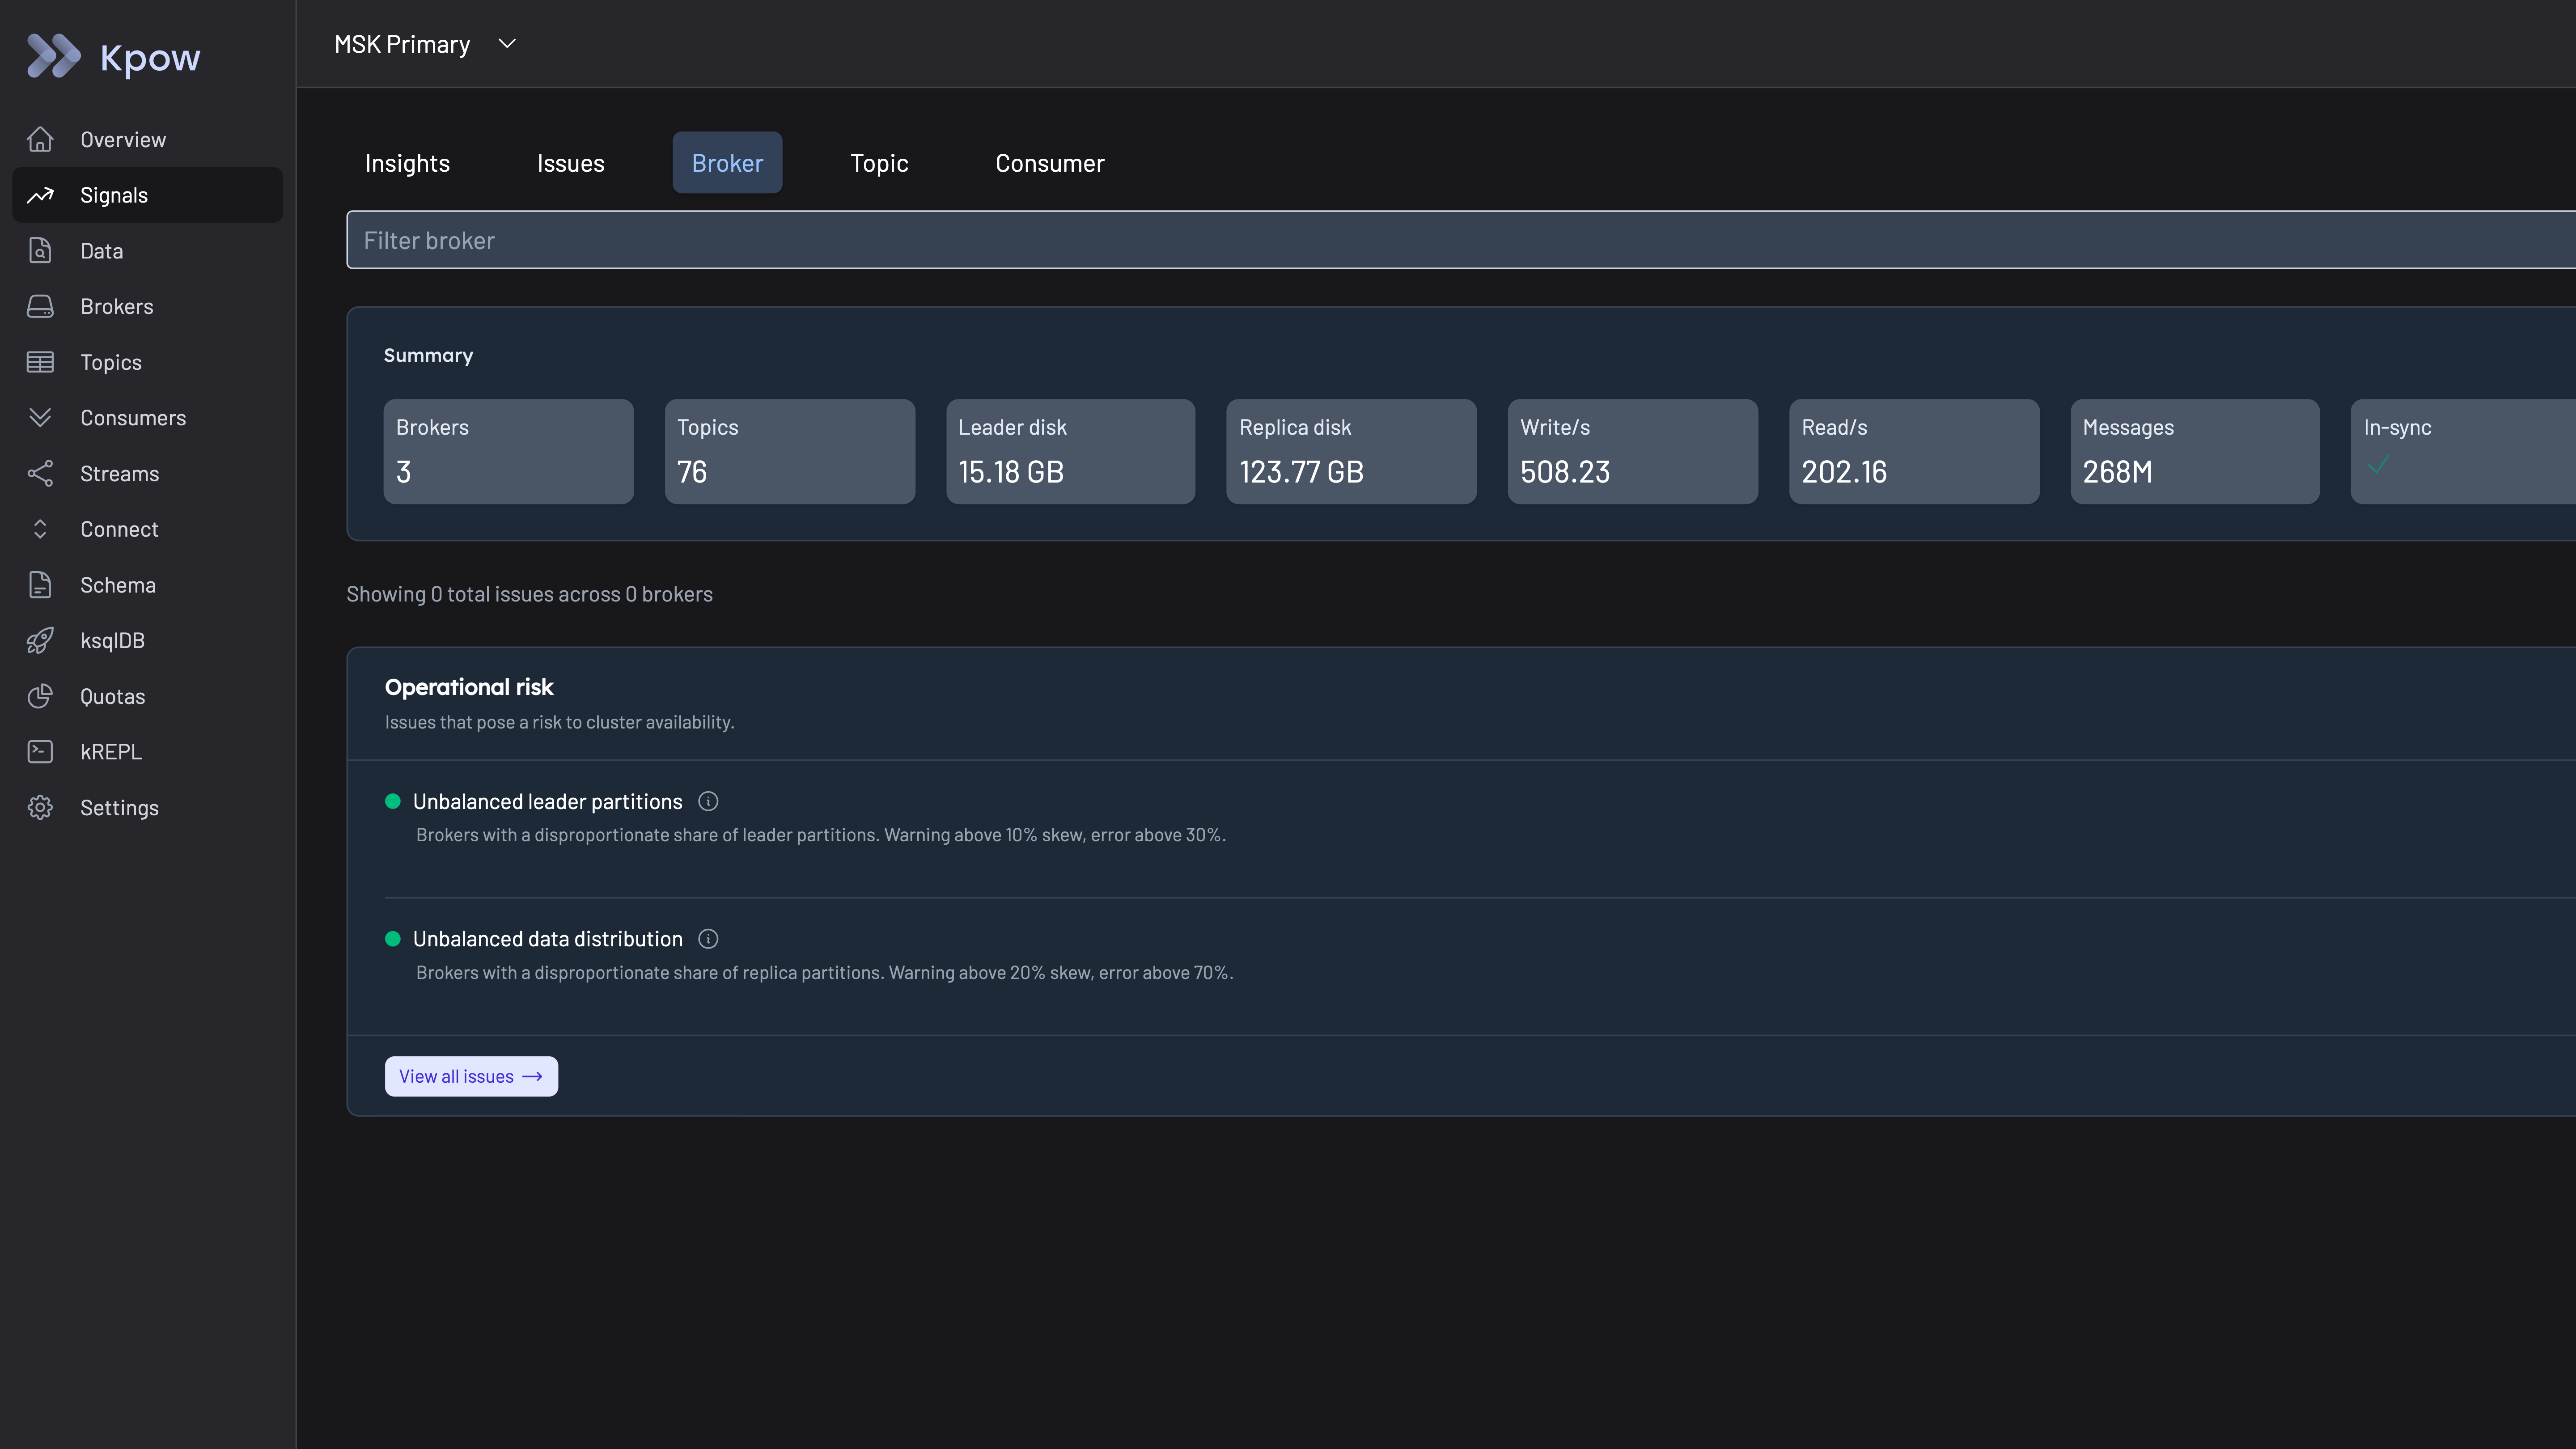
Kpow Signals, Broker tab: the cluster summary sits above the Operational risk panel, where the unbalanced leader partitions and unbalanced data distribution checks are both passing on this cluster.
Most Kafka observability setups rely on JMX metrics. They're broker-centric. They tell you about the JVM and the infrastructure, but they don't give you the Kafka-specific telemetry you actually need when something goes wrong: consumer lag by group, topic throughput, partition-level offsets, connector state.
Derek Troy-West, Co-founder and CEO of Factor House
How to choose
A config change is the suspect. Pair health monitoring with a tool that shows each broker’s running config, compared in the guide to Kafka broker config tools.
You already run Prometheus and Grafana. Add the JMX Exporter to every broker for latency and JVM, and add an Admin API view, kafka_exporter or Kpow, for replication state that does not depend on every broker reporting.
Your company standardises on Datadog or New Relic. Use its Kafka integration for broker JMX metrics, check the metric caps against your cluster size, and add an Admin API view for replication state if you need it during outages.
You run Confluent Platform. Control Center first, with a JMX pipeline for anything it does not surface.
You cannot install agents on the brokers. On a managed service, or where the platform team does not own the hosts, an Admin API tool such as Kpow, kafka_exporter or KMinion is the practical choice, alongside the provider’s own metrics.
FAQ
What are the most important Kafka broker health metrics?
Under-replicated partitions, partitions under min.insync.replicas, offline partitions, active controller count, ISR shrink rate, request handler and network processor idle ratios, request total time per request type, offline log directories and disk usage. The Apache Kafka monitoring documentation lists the expected value for each.
Can I monitor Kafka brokers without JMX?
Partly. Tools that use the Kafka Admin API, such as Kpow, kafka_exporter and KMinion, see replication state, leadership, the controller and disk usage without JMX. Request latency, thread idle ratios and the broker JVM are only exposed through JMX.
Is Prometheus and Grafana enough to monitor Kafka brokers?
For signal coverage, yes, with the JMX Exporter on every broker. The cost is building and maintaining the dashboards and alert rules yourself. Many teams add an opinionated console for the cluster-wide view and faster diagnosis.
How do I monitor broker health on a managed Kafka service?
Providers do a good job monitoring the brokers they run, and there are still metrics you should keep an eye on yourself, especially replication state and disk per topic. Use the provider’s metrics integration and an Admin API tool that connects as a client, since you cannot install agents on managed brokers.
How these tools were scored
1. Signal coverage. Which of the broker signals above the tool collects without extra work. Coverage matters because the usual dashboard stops at the obvious. From the Kafka operational issues talk: most teams already track consumer lag, broker CPU and memory, network throughput and under-replicated partitions, and “These are useful for telling you something is wrong, but not why.” Request latency components, thread idle ratios and ISR churn are what point at the why.
2. Accuracy when brokers are down. The moment you need the tool most is when part of the cluster is gone. A tool that depends on every broker reporting, or on the AdminClient seeing every broker, can undercount exactly when the count matters. Factor House changed Kpow’s own under-replicated partition calculation for this reason, iterating every topic partition rather than every broker, so the count stays correct when a broker is offline.
3. Collection method and overhead. JMX scraping needs remote JMX or an agent on every broker. Apache disables remote JMX by default and warns that it must be secured in production. Admin API tools need only a client connection, but they sample the cluster rather than stream every metric. Derek Troy-West, Factor House’s co-founder and CEO, was upfront about that trade in 2019, when Kpow was still called Operatr: it “computes all of its own telemetry from snapshots, regular snapshots of the cluster. So in some sense, it may be not appropriate for some people who are interested in very, very continuous sort of telemetry like Kafka provides itself.”
4. Granularity and cardinality. Per-broker is the minimum, and per-partition is where hot spots show up. Per-partition metrics also multiply series counts. That is why partition-level metrics often sit behind a flag: most teams do not want that level of detail all the time. A good tool lets you choose.
5. Alerting and history. Seeing a problem live is half the job. The tool needs to keep history and feed an alerting system, whether that is its own or Prometheus and Alertmanager.
6. Time to a useful view. Building broker dashboards from raw metrics is a lot of work, and as Chad Harris said in the talk’s Q&A, it is hard to know which dashboards you need until you have hit the next problem. Opinionated defaults that encode someone else’s incidents save you from learning each one the hard way.
Every option is scored from 0 to 10 on each criterion, from the evidence and sources this page cites, and the reason for each score is on its card. The criteria are weighted: Signal coverage counts once, Accuracy when brokers are down counts three times, Collection method and overhead counts once, Granularity and cardinality counts once, Alerting and history counts once and Time to a useful view counts once, for a total out of 80. Accuracy when brokers are down counts three times here, because a broker-health tool that goes blind at the moment a broker fails is not doing the job it was bought for. Signal coverage, collection method and overhead, granularity and cardinality, alerting and history, and time to a useful view all count once. This page is published by Factor House, which makes Kpow. Every option is scored on the same rubric and the same sources: Kpow's per-criterion scores are set the same way as every other option's and are not adjusted, and the weights apply to every option alike. Kpow ranks first on its total of 64 out of 80. The other options follow by total.