The best Kafka monitoring tools for 2026, by total score on this page’s weighted rubric, are Kpow (67 out of 70), Conduktor (48), AKHQ (46), Redpanda Console (40) and Lenses.io (40), with seven more scored below. Kpow puts broker and cluster health, consumer lag and message inspection in one container, with role-based access and audit on Enterprise. Prometheus and Grafana remain the right answer where you already run them and want to own the dashboards.
Apache Kafka monitoring is harder than it looks. By the time Kafka actually matters to your organisation, you’re running multiple clusters across cloud providers, Schema Registry is drifting, and the monitoring tool you stood up eighteen months ago now has its own Postgres database, its own backup regime, and a runbook for the rebalancing loop it enters every time a broker restarts.
A serious monitoring layer needs to handle at least six jobs simultaneously: broker and cluster health, consumer lag at the partition level, schema correctness, topology operations (Connect, Streams, Flink), message inspection during incidents, and, for regulated teams, governance including RBAC, SSO, audit logging, and PII masking. Most tools do one or two of those jobs well. Few handle all six without operational overhead that rivals the cluster itself.
This guide covers the twelve tools that come up most in production engineering conversations in 2026. If you’re evaluating management UIs more broadly, see the Best Kafka UI guide.
At a glance
Twelve options are scored here on this page's five weighted criteria, 70 points in all. The rubric is weighted: Enterprise readiness counts three times, and Deployment complexity, Pricing model, Managed service compatibility and Monitoring scope count once. The five listed first, of twelve, each out of 70: Kpow 67, which takes its best score on Enterprise readiness (10 out of 10) and its lowest on Deployment complexity (9 out of 10), Pricing: From $4,500/yr per cluster; AKHQ 46, License: Apache 2.0; Redpanda Console 40; Lenses.io 40, Pricing: Team from $4,000/yr, 15 users; Confluent Control Center 33, Pricing: Bundled with Confluent Platform.
12 best Kafka monitoring tools
| Rank | Tool | Type | Best for | Pricing |
|---|---|---|---|---|
| 1 | Kpow | Full-stack enterprise UI | Multi-cluster, regulated environments | From $4,500/yr per cluster |
| 2 | AKHQ | Open-source UI | Non-regulated teams, GitOps environments | Free (Apache 2.0) |
| 3 | Kafka UI (Provectus) | Open-source UI | Lightweight cluster visibility | Free (Apache 2.0) |
| 4 | Redpanda Console | Open-source UI | Redpanda-first teams | Free core; SSO/RBAC require Enterprise |
| 5 | Lenses.io | SQL-driven platform | SQL-over-Kafka and cross-cluster replication | From $4,000/yr (Team) |
| 6 | Kafdrop | Lightweight UI | Local and dev use | Free (Apache 2.0) |
| 7 | Burrow | Lag evaluator | Threshold-free lag alerting | Free (Apache 2.0) |
| 8 | Kminion | Metrics exporter | Prometheus-native consumer lag | Free (MIT) |
| 9 | Prometheus + Grafana | Metrics stack | Time-series alerting substrate | Free (OSS) |
| 10 | Confluent Control Center | Enterprise UI | All-in Confluent Platform deployments | Bundled with Confluent Platform |
| 11 | Datadog | SaaS observability | Teams standardised on Datadog | Per host + custom metrics |
| 12 | Conduktor | Commercial UI + proxy | Large-scale governance and multi-tenancy | Per seat + per cluster (Gateway) |
 Rank 1
 Kpow
67 out of 70 Total
Try Kpow in the live demo No signup needed.
- Type
- Full-stack enterprise UI
- Pricing
- From $4,500/yr per cluster
- Free tier
- Community Edition, 3 clusters, 10 users
- Deployment complexity
- 9 out of 10
- Enterprise readiness ×3 weight, this criterion counts 3 times toward the total
- 10 out of 10
- Pricing model
- 9 out of 10
- Managed service compatibility
- 10 out of 10
- Monitoring scope
- 9 out of 10
Why these scores for Kpow
- Deployment complexity 9 out of 10
- One stateless container, no Postgres, RocksDB or sidecars, no migrations or volumes. Kafdrop, ‘the lightest tool on this list’, scores higher.
- Enterprise readiness 10 out of 10
- RBAC, SSO (Okta, OIDC, SAML, LDAP, Keycloak), server-side PII masking and a SIEM-shippable audit log: every item the criterion lists.
- Pricing model 9 out of 10
- Per cluster, ‘the most predictable model’, 100 users included so cost stays flat with headcount; $4,500 is a real bill, so level with the free tools, not above.
- Managed service compatibility 10 out of 10
- First-class MSK IAM and native AWS Glue Schema Registry, ‘rare among competing tools’, across MSK, Confluent Cloud, Redpanda and self-managed from one install. Page’s best.
- Monitoring scope 9 out of 10
- Schema Registry, Connect, ksqlDB, kJQ inspection across JSON, Avro, Protobuf and Transit, per-partition lag; page names no Streams or Flink topology for it here.
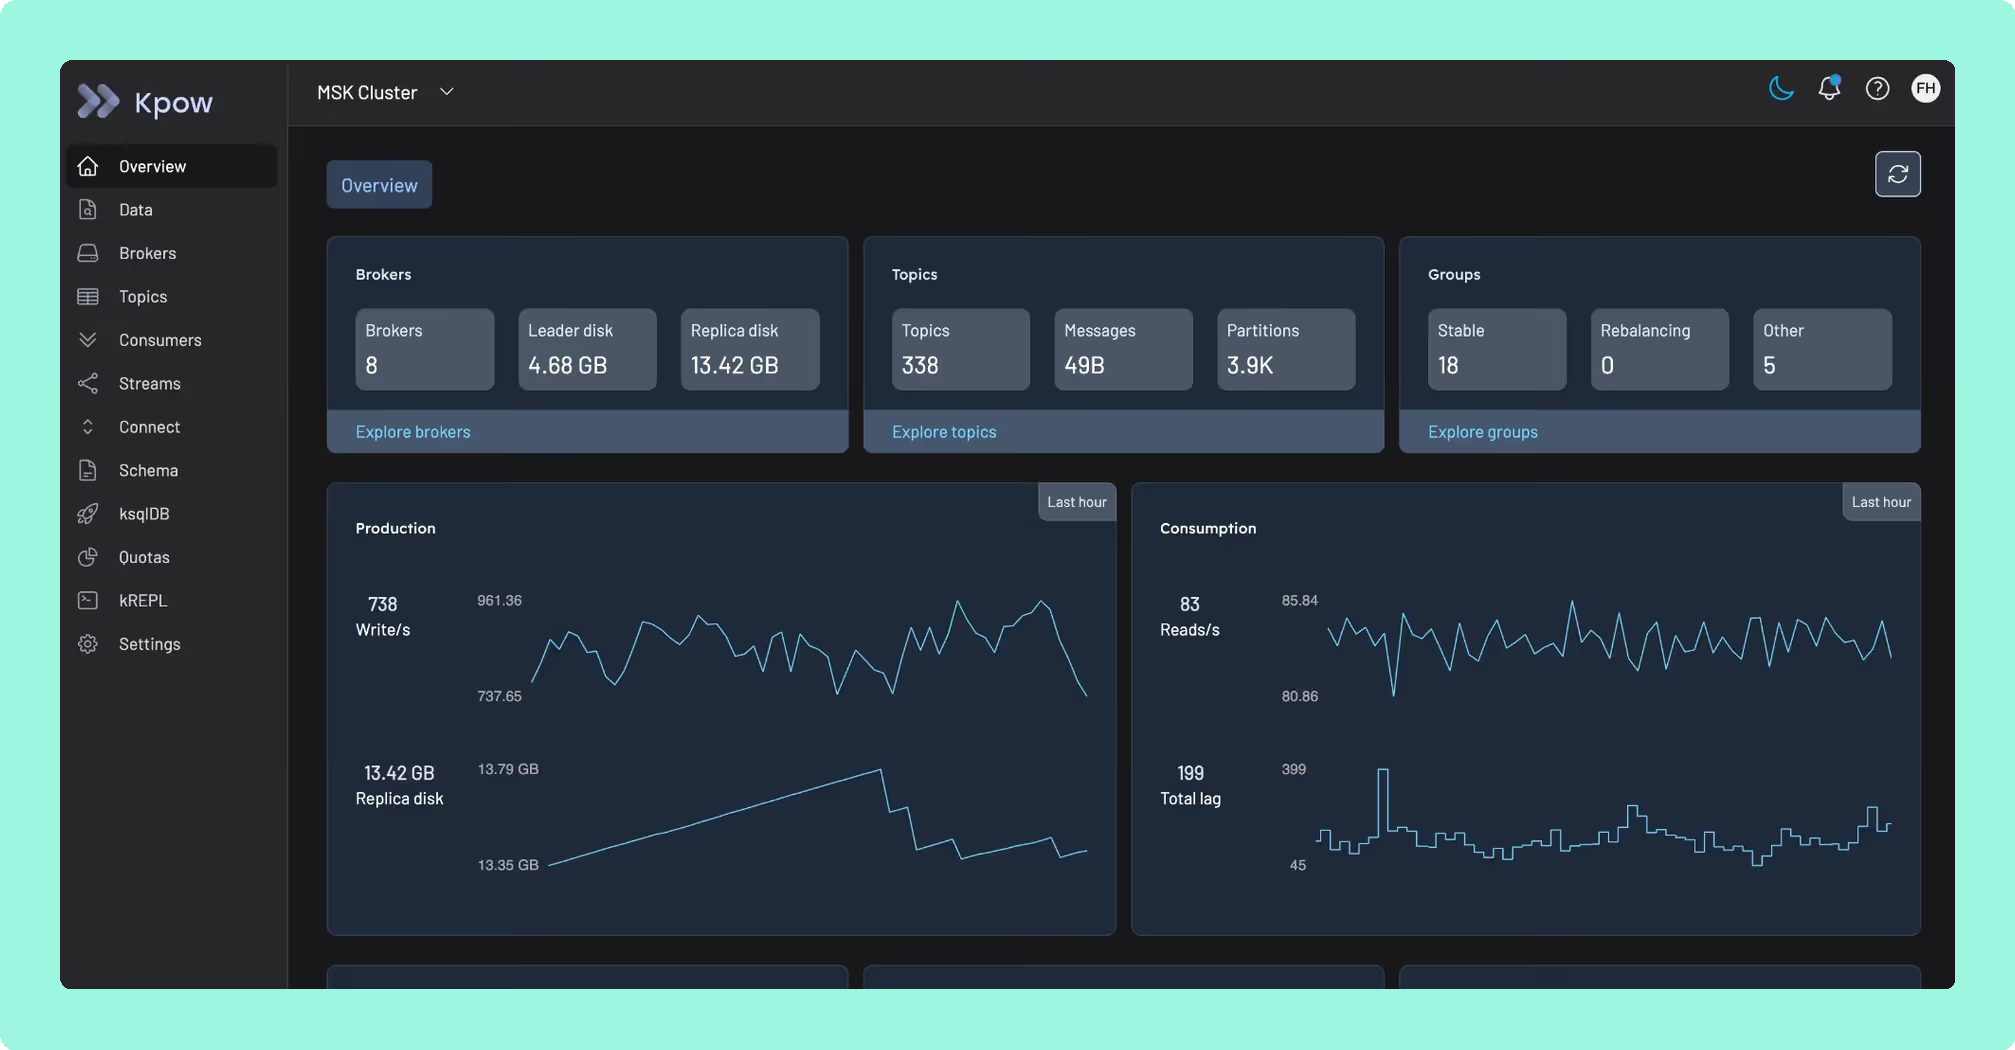
Overview. Kpow is a commercial enterprise UI and API for Apache Kafka and the surrounding ecosystem (Schema Registry, Kafka Connect, ksqlDB), covering monitoring, operations, and governance from a single stateless Docker container with zero external dependencies. It stores telemetry in internal Kafka topics on the cluster it monitors, so its resilience is tied directly to the cluster’s: if your cluster is up, Kpow is up.
Best for. Platform and SRE teams managing multiple clusters across MSK, Confluent Cloud, Redpanda, and self-managed brokers with enterprise security and compliance requirements. The default choice for financial services, healthcare, and fintech.
Strengths. Stateless single container with no Postgres, RocksDB, or sidecars to operate or back up. Full enterprise governance: RBAC, SSO (Okta, OIDC, SAML, LDAP, Keycloak), server-side PII masking, and a complete user-action audit log shippable to any SIEM. kJQ server-side message filtering across JSON, Avro, Protobuf, and Transit, with no throwaway consumer code required during incidents. First-class MSK IAM authentication and native AWS Glue Schema Registry support (rare among competing tools). Multi-cluster from a single install; Prometheus endpoints per cluster and topic feed your existing Grafana stack. Native KRaft support.
Limitations. Self-hosted only: you run it in your own VPC. There is no SaaS option. For security-conscious and regulated teams, this is an advantage; for teams that want managed hosting, it is a deployment step. The Community Edition covers up to 3 clusters and 10 users.
Set up and maintenance. docker pull factorhouse/kpow and configure via environment variables pointing at your cluster. No migrations, no stateful volumes. Upgrades are a container swap. Fully GitOps-compatible.
Pricing. Annual subscription, per cluster, with 100 users included (unlimited available), so cost stays flat as your team grows. Available direct or via AWS Marketplace (hourly metered or annual cluster credits). Starting at $4,500/year. Start free with Community Edition on up to 3 clusters, or try Enterprise for free.
Staying patched. Kpow’s release notes name the CVEs each release remediates, and the 96.4 image built on 5 August 2026 bundles 311 dependencies. What a licence buys here is not a different deployment model, because Kpow is self-hosted too. It is a company contracted to ship the fix. Every dependency figure on this page was read on 24 September 2026 from the published artefacts and from nvd.nist.gov.
Compare Kpow vs AKHQKpow vs Confluent Control CenterKpow vs Redpanda ConsoleKpow vs KafdropKpow vs Lenses.io
 Rank 2
 AKHQ
46 out of 70 Total
- Type
- Open-source UI
- Formerly
- KafkaHQ
- License
- Apache 2.0
- Deployment complexity
- 8 out of 10
- Enterprise readiness ×3 weight, this criterion counts 3 times toward the total
- 5 out of 10
- Pricing model
- 9 out of 10
- Managed service compatibility
- 7 out of 10
- Monitoring scope
- 7 out of 10
Why these scores for AKHQ
- Deployment complexity 8 out of 10
- Single stateless Docker container, YAML-driven, straightforward upgrades.
- Enterprise readiness 5 out of 10
- LDAP, OIDC, GitHub SSO, JWT, Keycloak; masking is global YAML and audit is opt-in to a topic with no in-product view.
- Pricing model 9 out of 10
- Free, Apache 2.0, at any team size; the page’s caveat is that ‘ongoing maintenance falls to your team’.
- Managed service compatibility 7 out of 10
- Multi-cluster via YAML (page); MSK IAM supported per the AKHQ review. Below Kpow, whose MSK IAM and Glue support the page calls rare.
- Monitoring scope 7 out of 10
- Topics, consumer groups, Schema Registry, Connect, KSQL, Avro/Protobuf deserialization, Live Tail; ‘known UI performance issues at high partition counts’.
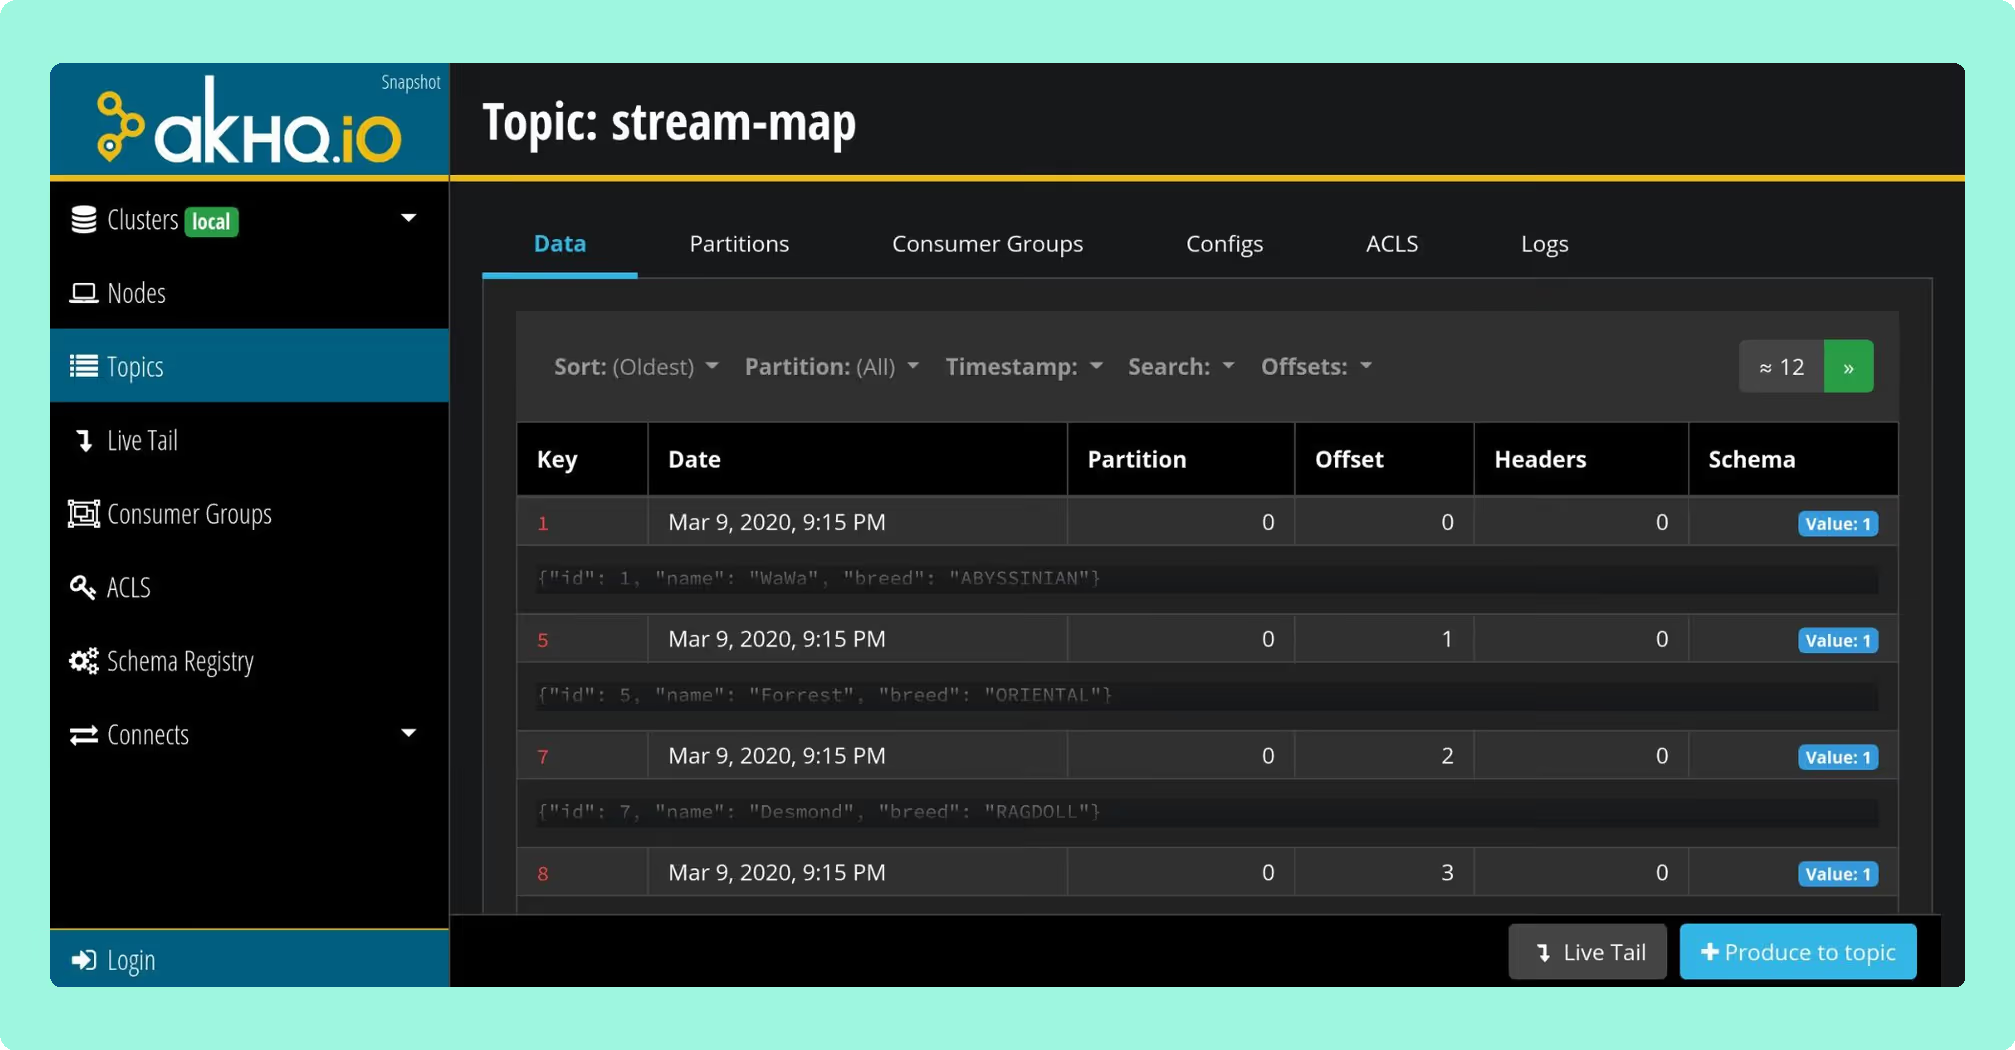
Overview. AKHQ is the most capable free open-source option for teams that have outgrown simple topic browsers. Deployed as a single stateless Docker container configured in YAML, it covers topics, consumer groups, Schema Registry, Kafka Connect, KSQL, Avro/Protobuf deserialization, and Live Tail.
Best for. Cost-conscious engineering teams in non-regulated environments running GitOps-style Kafka setups. Community support only.
Strengths. Broad feature coverage for a free tool. Auth backends include LDAP, OAuth2/OIDC, GitHub SSO, JWT, and Keycloak. Multi-cluster support via YAML. GitOps-friendly: connections and role bindings are declared in application.yml.
Limitations. Data masking is global: filters live in application YAML keyed on topic and field path, one filter per topic, so what is hidden does not vary by who is looking. Audit logging is opt-in and written to a Kafka topic you nominate, with no view inside the product. Community support only. Incident resolution goes through GitHub issues. Known UI performance issues at high partition counts.
Set up and maintenance. Single Docker container, YAML-driven. Stateless, so upgrades are straightforward. Ongoing maintenance falls to your team.
Pricing. Free (Apache 2.0 license).
Staying patched. AKHQ has no CVE filed against its own code, and that is the wrong number to plan against. Release 0.28.0, cut on 6 August 2026, bundles 270 libraries and 18 of them carry a high or critical advisory. Sixteen were already public, with fixed versions already on Maven Central, on the day it shipped, and five are netty advisories Kpow had remediated three weeks earlier in 96.2: CVE-2026-44249, CVE-2026-45416, CVE-2026-45674, CVE-2026-47691 and CVE-2026-50010. The oldest has been open 108 days. That is exposure and remediation latency rather than a working attack, and every figure resolves against the published jar and nvd.nist.gov. Four releases in two years, and no security policy at any path GitHub reads.
Compare Kpow vs AKHQAKHQ vs KafdropAKHQ vs Redpanda ConsoleAKHQ review
Redpanda Console
redpanda.com
40 out of 70 Total
- Type
- Open-source UI
- Formerly
- Kowl
- SSO and RBAC
- Redpanda Enterprise license
- Deployment complexity
- 8 out of 10
- Enterprise readiness ×3 weight, this criterion counts 3 times toward the total
- 6 out of 10
- Pricing model
- 5 out of 10
- Managed service compatibility
- 3 out of 10
- Monitoring scope
- 6 out of 10
Why these scores for Redpanda Console
- Deployment complexity 8 out of 10
- Single binary or container, stateless; one instance per cluster, so multi-cluster means multiple deployments.
- Enterprise readiness 6 out of 10
- SSO and RBAC only with a Redpanda Enterprise license; basic auth with no role bindings without it.
- Pricing model 5 out of 10
- Free BSL core, but governance needs an Enterprise license via sales, and ‘vanilla Kafka or MSK teams pay for a license tied to a broker they are not using’.
- Managed service compatibility 3 out of 10
- ‘Enterprise features are Redpanda-first’; one Console per Kafka cluster; MSK teams license a broker they do not run.
- Monitoring scope 6 out of 10
- Push Filters are ‘the best message inspection experience in any open-source tool’; the page names no lag, Schema Registry or Connect coverage for it.
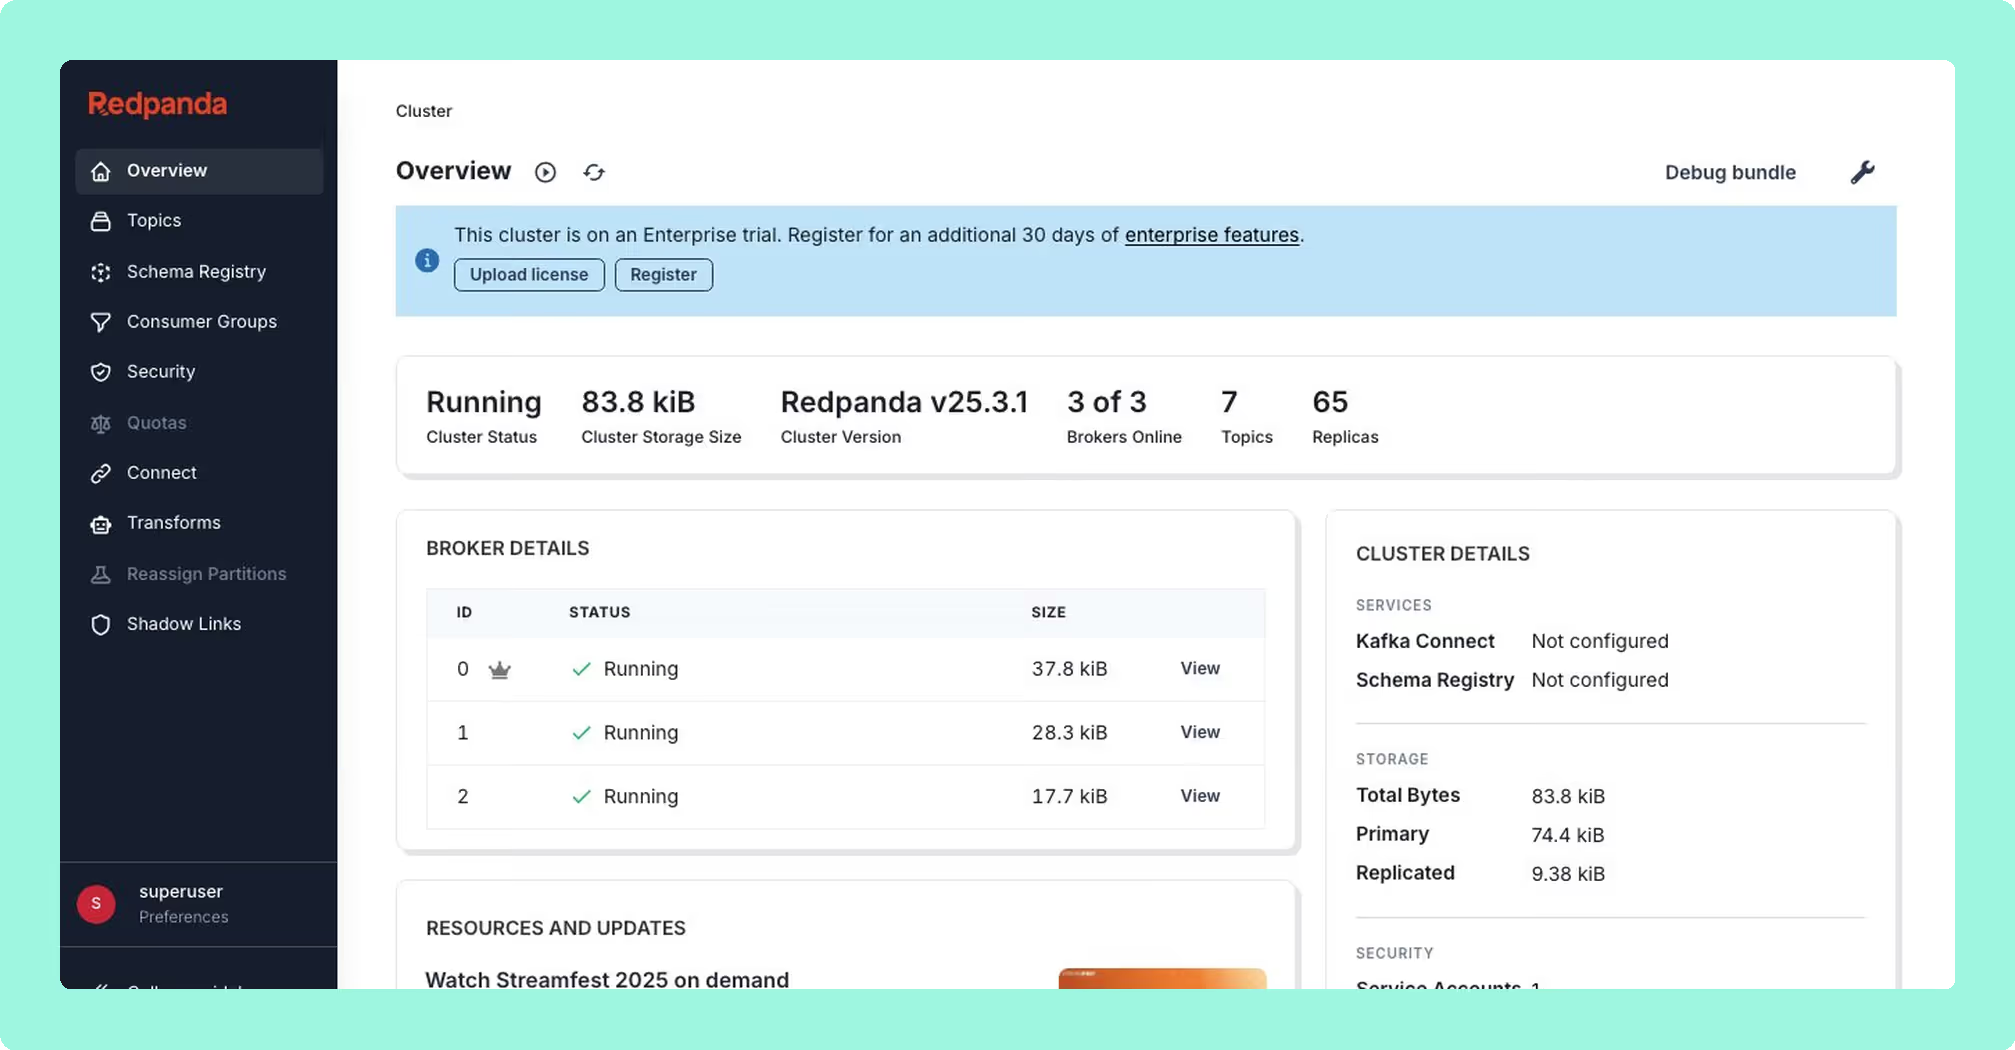
Overview. Originally built as Kowl, acquired by Redpanda in 2022 and now maintained with full-time engineering resources. Despite the branding, the core tool works against any Kafka-API-compatible cluster, though enterprise features are Redpanda-first.
Best for. Teams running Redpanda as their primary broker, or small Kafka teams comfortable with basic auth on a single cluster.
Strengths. Polished developer UX. Programmable Push Filters (JavaScript-based server-side message filtering) is the best message inspection experience in any open-source tool. Active release cadence. Stateless single-binary deployment.
Limitations. SSO and RBAC require a Redpanda Enterprise license, explicitly required in the console.yaml config. Without it, you are on basic auth with no role bindings. Vanilla Kafka or MSK teams pay for a license tied to a broker they are not using. A single Console instance maps to a single Kafka cluster.
Set up and maintenance. Single binary or Docker container. Stateless and straightforward to deploy. Multi-cluster requires multiple deployments.
Pricing. The community edition is free under the Business Source License (BSL). SSO and RBAC require Redpanda Enterprise license, available via enterprise sales.
Compare Kpow vs Redpanda ConsoleAKHQ vs Redpanda ConsoleConduktor vs Redpanda ConsoleRedpanda Console review
 Rank 4
 Lenses.io
lenses.io
40 out of 70 Total
- Type
- SQL-driven platform
- Pricing
- Team from $4,000/yr, 15 users
- Runs on
- Kubernetes
- Deployment complexity
- 2 out of 10
- Enterprise readiness ×3 weight, this criterion counts 3 times toward the total
- 7 out of 10
- Pricing model
- 4 out of 10
- Managed service compatibility
- 6 out of 10
- Monitoring scope
- 7 out of 10
Why these scores for Lenses.io
- Deployment complexity 2 out of 10
- Multi-container Kubernetes deployment, SQL Processors as pods, ‘requires a platform team’. Still above Control Center, which the page calls the heaviest.
- Enterprise readiness 7 out of 10
- This page names none; SSO, SAML and RBAC from Team, in-product audit, masking global by field name rather than by role.
- Pricing model 4 out of 10
- Tiered by capability with a user cap per rung (Team $4,000 a year for 15 users, Enterprise custom); the page flags strategic uncertainty after the Celonis acquisition.
- Managed service compatibility 6 out of 10
- Multi-Kafka global catalog and K2K cross-cluster replication; page names no MSK IAM or Glue support.
- Monitoring scope 7 out of 10
- SQL studio over Kafka streams, topology view, global catalog; page names no per-partition lag or Connect management for it.
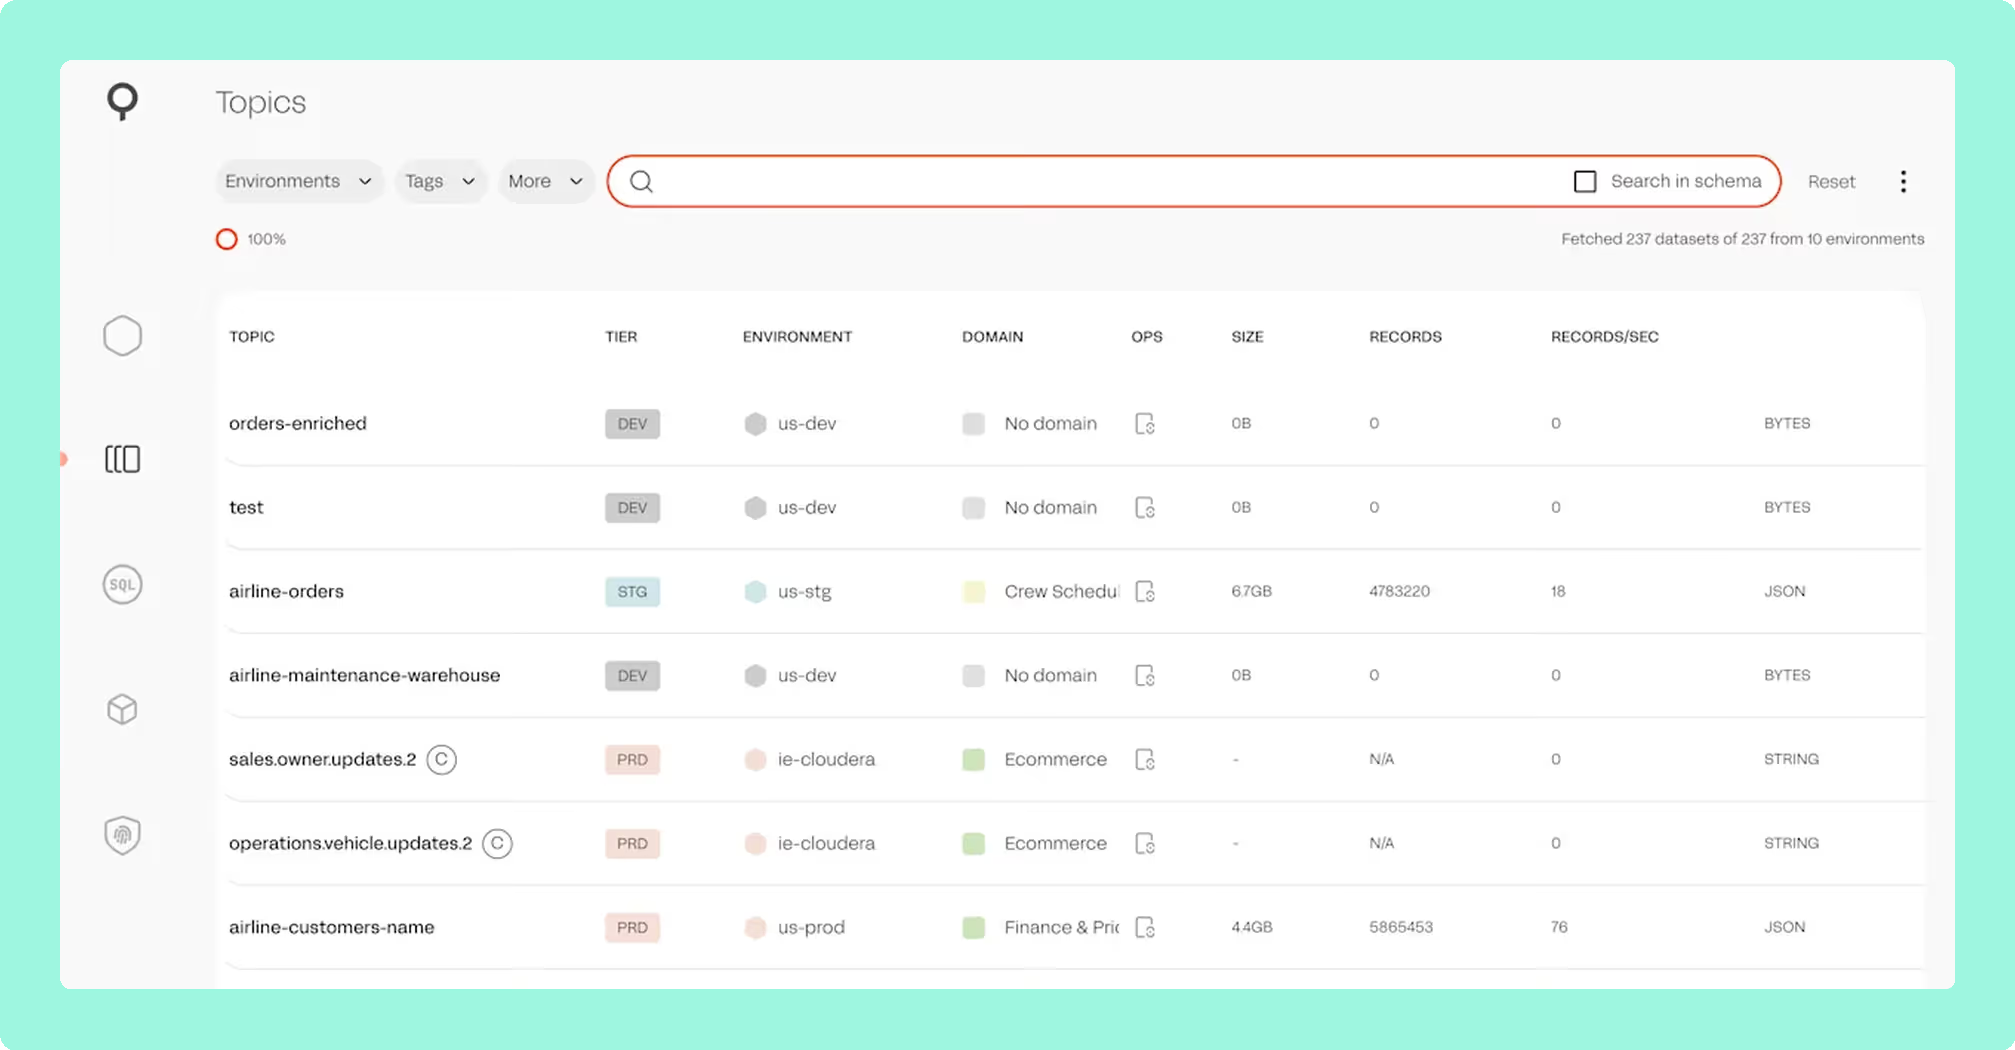
Overview. Lenses treats Kafka as a data platform: a SQL studio for querying and transforming Kafka streams, a graph-based topology view, a multi-Kafka global catalog, and a K2K cross-cluster replicator. Acquired by Celonis; community feedback indicates development as a standalone product has slowed.
Best for. Larger enterprises that specifically need SQL-driven data exploration over Kafka and cross-cluster replication, with an existing Kubernetes platform team to operate the Lenses infrastructure.
Strengths. SQL-over-Kafka workflows with no direct equivalent elsewhere. Topology visualisation. K2K cross-cluster replication. Multi-cluster global catalog.
Limitations. SQL Processors execute as Kubernetes pods, so production deployments require a Kubernetes platform team. Licensing is tiered by capability, with a user cap at each tier below Enterprise. Strategic uncertainty following the Celonis acquisition is worth factoring into any vendor evaluation.
Set up and maintenance. Multi-container Kubernetes deployment. Significant operational overhead; requires a platform team to own the Lenses infrastructure.
Pricing. Team starts at $4,000 a year for up to 15 users. Multi-Kafka Enterprise is custom priced.
Compare Kpow vs Lenses.ioAKHQ vs LensesConduktor vs LensesLenses.io review
Confluent Control Center
confluent.io
33 out of 70 Total
- Type
- Enterprise UI
- Pricing
- Bundled with Confluent Platform
- Sizing
- 4 cores, 8 GB, 200 GB up to 100,000 replicas
- Deployment complexity
- 1 out of 10
- Enterprise readiness ×3 weight, this criterion counts 3 times toward the total
- 7 out of 10
- Pricing model
- 2 out of 10
- Managed service compatibility
- 1 out of 10
- Monitoring scope
- 8 out of 10
Why these scores for Confluent Control Center
- Deployment complexity 1 out of 10
- ‘Operationally heavyweight compared to every other tool on this list’: dedicated sized host, RocksDB state, two instances for HA. Scored below Lenses and Conduktor.
- Enterprise readiness 7 out of 10
- Mature SSO and RBAC inside the Confluent ecosystem.
- Pricing model 2 out of 10
- No standalone purchase; bundled with Confluent Platform, which ‘typically lands between $50K and $500K+ per year’.
- Managed service compatibility 1 out of 10
- This page says it ‘Does not work meaningfully against MSK or vanilla Apache Kafka’, and its FAQ answers ‘No, not meaningfully.’ Something remains inside Confluent Platform.
- Monitoring scope 8 out of 10
- This page gives deep Confluent-native telemetry, Stream Lineage ‘unavailable in any other tool’, KSQL, Schema Registry and Replicator, which is the widest named scope after Kpow.
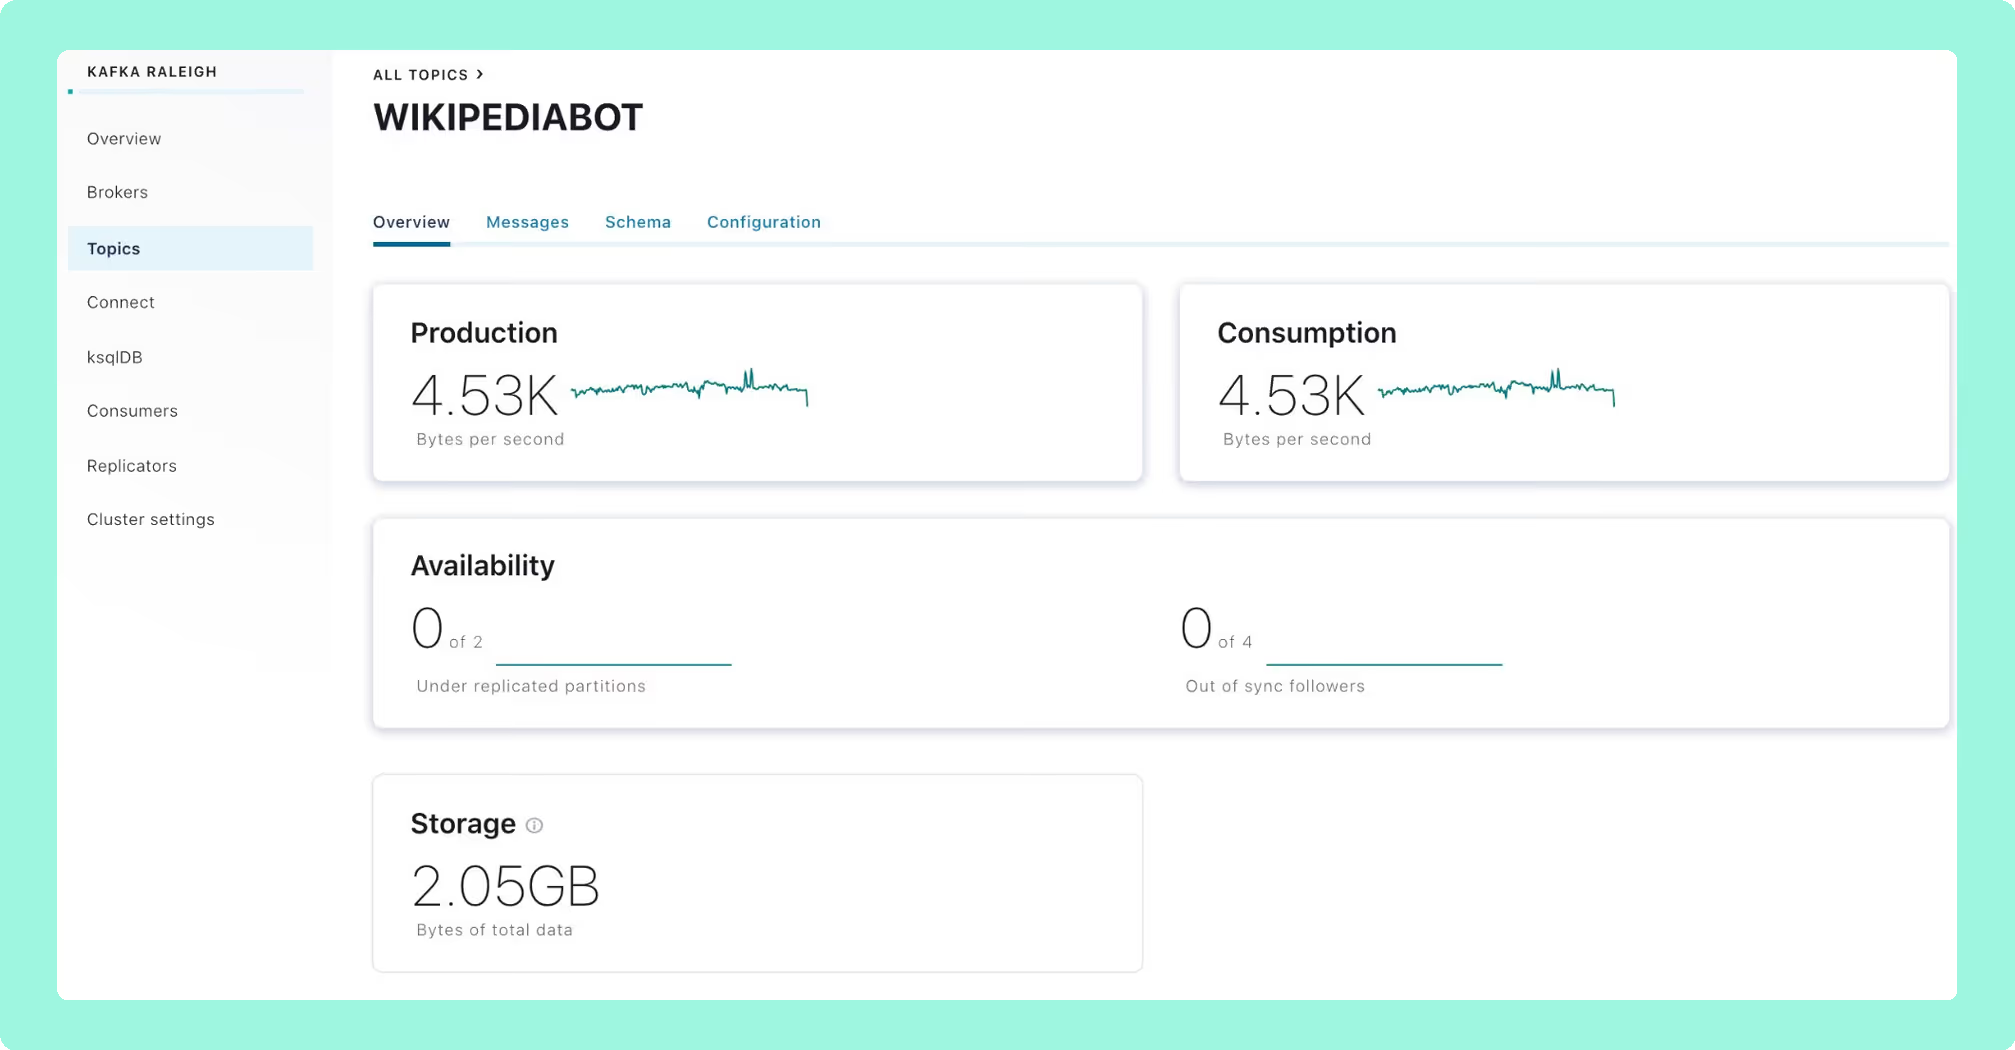
Overview. Confluent Control Center (C3) is the official management interface for Confluent Platform, providing deep integration across the Confluent stack: Stream Lineage, KSQL, Schema Registry, Replicator, and RBAC via Confluent’s Metadata Service.
Best for. Teams fully committed to Confluent Platform on-prem with the infrastructure headroom for a dedicated host. Not suitable for mixed-broker fleets.
Strengths. Deep Confluent-native telemetry. Stream Lineage is unavailable in any other tool. Mature SSO and RBAC integration within the Confluent ecosystem.
Limitations. A heavy infrastructure commitment: Confluent sizes it at 4 cores, 8 GB of RAM and 200 GB of storage for clusters up to 100,000 replicas, and 8 cores, 16 GB and 300 GB above that. C3 is a Kafka Streams application with RocksDB-backed local state. LockException rebalancing loops under sustained load are a documented community issue. It does not work meaningfully against MSK or vanilla Apache Kafka.
Set up and maintenance. Deployed as part of a full Confluent Platform installation. High availability requires two instances behind a load balancer. Operationally heavyweight compared to every other tool on this list.
Pricing. Bundled with Confluent Platform Enterprise. No standalone purchase. Confluent Platform typically lands between $50K and $500K+ per year.
Compare Kpow vs Confluent Control CenterAKHQ vs Confluent Control CenterConduktor vs Confluent Control CenterConfluent Control Center review
Kafka UI (Provectus)
31 out of 70 Total
- Type
- Open-source UI
- Status
- Original repo no longer maintained
- License
- Apache 2.0
- Deployment complexity
- 8 out of 10
- Enterprise readiness ×3 weight, this criterion counts 3 times toward the total
- 1 out of 10
- Pricing model
- 8 out of 10
- Managed service compatibility
- 6 out of 10
- Monitoring scope
- 6 out of 10
Why these scores for Kafka UI (Provectus)
- Deployment complexity 8 out of 10
- Single Docker container, YAML configuration, low operational overhead.
- Enterprise readiness 1 out of 10
- No native auth or RBAC, security delegated to a reverse proxy, no masking, no audit trail, ‘not appropriate for regulated environments’.
- Pricing model 8 out of 10
- Free, Apache 2.0; with the original repository no longer maintained, every patch is engineering time the page says to count.
- Managed service compatibility 6 out of 10
- Multi-cluster comes via YAML, and the page names no MSK IAM or Glue support.
- Monitoring scope 6 out of 10
- It covers topic management, consumer group lag, Schema Registry, Connect and basic message browsing, which is the basics and less than AKHQ.

Overview. Kafka UI, built by Provectus, is a free open-source web interface for Apache Kafka. It provides topic management, consumer group lag monitoring, Schema Registry integration, Kafka Connect management, and basic message browsing from a single Docker container.
Best for. Teams that want a lightweight, free UI for quick cluster visibility without compliance requirements.
Strengths. Easy to stand up and configure. Covers the basics well: topic listing, consumer lag, Schema Registry, and Kafka Connect. Multi-cluster support via YAML.
Limitations. No native authentication or RBAC: security is delegated to a reverse proxy. No data masking, no user audit trail. Less feature-complete than AKHQ for teams that need auth or more advanced tooling. Not appropriate for regulated environments. The original Provectus repository is no longer maintained; Kafbat UI is the fork that continues its codebase.
Set up and maintenance. Single Docker container, YAML configuration. Low operational overhead for development and evaluation environments.
Pricing. Free (Apache 2.0 license).
Staying patched. Provectus kafka-ui has not cut a release since April 2024 and has had no push since July 2024. Its last release bundles Apache Avro 1.11.1, carrying an arbitrary-code-execution advisory public since October 2024, 721 days, and only 128 of its 203 bundled jars resolved to a coordinate, so its counts are a floor. Two further CVEs have been filed against the project itself since, CVE-2026-5562 and CVE-2026-78166, and NVD records that the maintainers did not respond to the disclosure.
Compare Kafbat UI review
Burrow
29 out of 70 Total
- Type
- Lag evaluator
- Reads
- __consumer_offsets
- Latest release
- v1.9.6, May 2026
- Deployment complexity
- 8 out of 10
- Enterprise readiness ×3 weight, this criterion counts 3 times toward the total
- 2 out of 10
- Pricing model
- 9 out of 10
- Managed service compatibility
- 4 out of 10
- Monitoring scope
- 2 out of 10
Why these scores for Burrow
- Deployment complexity 8 out of 10
- Single Go binary with an HTTP API and no external dependencies, ‘minimal operational overhead’.
- Enterprise readiness 2 out of 10
- No UI; page names no access control or audit, and it exposes no messages to mask.
- Pricing model 9 out of 10
- Free, Apache 2.0, minimal upkeep.
- Managed service compatibility 4 out of 10
- Reads __consumer_offsets; page gives no managed-service evidence.
- Monitoring scope 2 out of 10
- ‘A single-purpose tool built for one job’: consumer lag evaluation. Its lag is more nuanced than kafka_exporter’s, but it covers nothing else the criterion lists.
Overview. Burrow is a single-purpose tool built by LinkedIn for one job: threshold-free consumer lag evaluation. It reads __consumer_offsets, evaluates each consumer group’s lag over a sliding window, and returns an OK, WARN, or ERROR status via an HTTP API. No UI. No external database.
Best for. SRE teams that want a programmatic lag evaluation service as a component of their alerting pipeline. An excellent addition to a broader stack, not a standalone solution.
Strengths. Threshold-free evaluation eliminates false positives from traffic spikes. Burrow evaluates whether the consumer is making progress relative to the window, not whether lag exceeds an arbitrary number. Lightweight Go binary with no external dependencies.
Limitations. No UI. It is still maintained, with v1.9.6 released in May 2026.
Set up and maintenance. Single Go binary, HTTP API. Minimal operational overhead.
Pricing. Free (Apache 2.0 license).
Staying patched. Burrow is Apache-2.0 and moves slowly: seven releases in two years, a 221-day gap between October 2025 and May 2026, no CVE filed against its own code and no security policy in the repository root. A dependency advisory waits for whoever volunteers to cut the next release.
Kminion
28 out of 70 Total
- Type
- Metrics exporter
- Runs as
- Stateless Go binary
- License
- MIT
- Deployment complexity
- 6 out of 10
- Enterprise readiness ×3 weight, this criterion counts 3 times toward the total
- 2 out of 10
- Pricing model
- 9 out of 10
- Managed service compatibility
- 4 out of 10
- Monitoring scope
- 3 out of 10
Why these scores for Kminion
- Deployment complexity 6 out of 10
- Single stateless Go binary, low overhead, but ‘requires Prometheus and Grafana to be useful’.
- Enterprise readiness 2 out of 10
- Metrics exporter with no UI; page names no access control or audit, and it exposes no messages to mask.
- Pricing model 9 out of 10
- Free, MIT, low upkeep.
- Managed service compatibility 4 out of 10
- This page gives no managed-service evidence; it measures from outside the cluster.
- Monitoring scope 3 out of 10
- Per-partition lag, group state and end-to-end latency probes, richer than kafka_exporter, but ‘no UI, no operations capability’.
Overview. Kminion is a Go-based Kafka metrics exporter that exposes detailed consumer group and topic metrics in Prometheus format. It provides richer consumer group lag data than the standard kafka_exporter, including per-partition lag, consumer group state, and end-to-end latency measurement via configurable test producers.
Best for. SRE teams building a Prometheus-native Kafka monitoring stack who need more consumer group telemetry detail than the standard kafka_exporter provides.
Strengths. More complete consumer group metrics than kafka_exporter. Lightweight stateless Go binary. End-to-end latency probing with configurable test producers and consumers. Prometheus-native from the ground up.
Limitations. Metrics exporter only: no UI, no operations capability. Requires Prometheus and Grafana to be useful. Measures from outside the cluster, which is less nuanced than internal compute approaches.
Set up and maintenance. Single Go binary or Docker container. Environment variable configuration. Low operational overhead.
Pricing. Free (MIT license).
Staying patched. KMinion is MIT and actively released, v2.3.6 in September 2026, with no CVE filed against its own code. There is no support contract behind it, so a dependency advisory is yours to track and to rebuild for.
25 out of 70 Total
- Type
- Lightweight UI
- Heap
- 64 MB
- License
- Apache 2.0
- Deployment complexity
- 10 out of 10
- Enterprise readiness ×3 weight, this criterion counts 3 times toward the total
- 0 out of 10
- Pricing model
- 9 out of 10
- Managed service compatibility
- 2 out of 10
- Monitoring scope
- 4 out of 10
Why these scores for Kafdrop
- Deployment complexity 10 out of 10
- ‘The lightest tool on this list’: one Spring Boot container at 64 MB heap, env-var config.
- Enterprise readiness 0 out of 10
- No authentication or RBAC, no audit logging, no data masking.
- Pricing model 9 out of 10
- Free, Apache 2.0, minimal upkeep; the page’s maintenance-hours caveat applies.
- Managed service compatibility 2 out of 10
- ‘No multi-cluster support’, single cluster per deployment; page names nothing on MSK or managed services.
- Monitoring scope 4 out of 10
- Per-partition lag, message browsing (JSON, Avro, Protobuf), Schema Registry, ACLs, but no Connect: ‘not a monitoring solution’.

Overview. Kafdrop is the lightest tool on this list: a single Spring Boot container configurable to run at 64 MB heap. It covers topic listing, message browsing (JSON, Avro, Protobuf), per-partition consumer lag, ACL viewing, basic topic management, and Schema Registry integration.
Best for. Local development, dev team internal use on a single cluster, or quick sanity checks. Not a production monitoring platform.
Strengths. Minimal resource footprint. Fast to stand up. Useful as a read-only cluster inspection tool in development environments.
Limitations. No authentication or RBAC (security delegated entirely to a reverse proxy), no Kafka Connect management, no audit logging, no data masking, no multi-cluster support. A UI for looking at topics and messages, not a monitoring solution.
Set up and maintenance. Single container, environment variable configuration. Minimal operational overhead.
Pricing. Free (Apache 2.0 license).
Staying patched. Kafdrop released 4.3.0 on 31 August 2026 bundling Tomcat 11.0.22, which had carried three critical advisories since 25 August, six days earlier. One of them, CVE-2026-65905, scores 9.8 and is an authentication bypass, and all three are still in the current release. Only 66 of its 118 bundled jars resolved to a coordinate, so those counts are a floor rather than a total. Three releases in two years, 106 of its last 132 commits from a dependency bot, and no security policy at any path GitHub reads.
 Rank 10
 Prometheus + Grafana
25 out of 70 Total
- Type
- Metrics stack
- Parts
- JMX Exporter, kafka_exporter, Prometheus, Grafana
- Pricing
- Free (OSS)
- Deployment complexity
- 4 out of 10
- Enterprise readiness ×3 weight, this criterion counts 3 times toward the total
- 2 out of 10
- Pricing model
- 7 out of 10
- Managed service compatibility
- 4 out of 10
- Monitoring scope
- 4 out of 10
Why these scores for Prometheus + Grafana
- Deployment complexity 4 out of 10
- JMX agents on every broker, scrape config and dashboards: the per-broker agent the criterion counts as a liability; ‘significant initial configuration effort’.
- Enterprise readiness 2 out of 10
- This page names no RBAC, SSO or audit log for the stack; ‘not an operations UI’, so it shows no messages to mask. Not 0: the page does not say they are missing.
- Pricing model 7 out of 10
- Free OSS with paid Grafana Cloud tiers; the configuration effort is exactly the engineering time the criterion says to count.
- Managed service compatibility 4 out of 10
- This page gives no managed-service evidence; its only named collection path is a JMX agent on each broker.
- Monitoring scope 4 out of 10
- De facto standard for broker time-series metrics, lag via kafka_exporter ‘less nuanced’; no topic browser, message inspection or connector management.

Overview. Not a product but a stack you assemble: the JMX Prometheus Exporter as a Java agent on each broker, danielqsj/kafka_exporter for consumer group lag, Prometheus to scrape, and Grafana to visualise. Every commercial tool in this list exposes Prometheus endpoints to feed back into this stack, which tells you how foundational it is.
Best for. Every Kafka team, as the time-series metrics and alerting substrate. Not a standalone solution. Layer a dedicated operations UI on top.
Strengths. Free, widely understood, integrates into existing infrastructure monitoring, de facto standard for Kafka time-series metrics, enormous community dashboard ecosystem.
Limitations. Not an operations UI. No topic browser, no message inspection, no offset reset, no connector management. Setup requires JMX agents on every broker and careful configuration. Consumer lag via kafka_exporter is less nuanced than Burrow or Kpow’s internal compute. Dashboard versioning breaks between JMX Exporter 0.x and 1.x.
Set up and maintenance. JMX agents on every broker, Prometheus scrape config, Grafana dashboard management. Medium operational overhead; significant initial configuration effort.
Pricing. Free (OSS). Grafana Cloud has paid tiers for managed hosting.
Staying patched. Prometheus and Grafana are both open source and both actively released, and neither comes with anybody contracted to patch the stack you assemble from them. A dependency advisory in either reaches your cluster when you rebuild the images, on your schedule, which is the trade you are making for the licence you are not paying.
Chad Harris's take. Back in the day there was no tooling, so we were always cobbling together Grafana dashboards. The dashboards get better after every incident, but it’s a lot of work, and I think the problem is that it’s hard to know what dashboards you should build until you’ve found the next problem. (From his talk Things that go bump in the night: Kafka operational issues.)
 Rank 11
 Datadog
datadoghq.com
21 out of 70 Total
- Type
- SaaS observability
- Custom metrics
- $5 per 100 per month over allowance
- On MSK
- CloudWatch-based integration
- Deployment complexity
- 5 out of 10
- Enterprise readiness ×3 weight, this criterion counts 3 times toward the total
- 2 out of 10
- Pricing model
- 2 out of 10
- Managed service compatibility
- 3 out of 10
- Monitoring scope
- 5 out of 10
Why these scores for Datadog
- Deployment complexity 5 out of 10
- It is SaaS, but with ‘a Datadog Agent on every broker’, the per-broker agent this criterion counts as a liability.
- Enterprise readiness 2 out of 10
- This page names no Kafka access control or audit; it cannot browse messages or act on the cluster, so there is nothing to mask.
- Pricing model 2 out of 10
- Per host plus custom-metric overage plus a DSM SKU; per-host ‘penalises horizontal scaling’ and ‘costs scale significantly at large cluster sizes’.
- Managed service compatibility 3 out of 10
- ‘For MSK, falls back to the lower-fidelity CloudWatch-based integration.’
- Monitoring scope 5 out of 10
- Broker, topic, partition and JVM metrics plus Data Streams Monitoring latency and lag, but it ‘cannot browse messages, reset consumer offsets, manage Connect connectors, or view schema versions’.
Overview. Datadog is a metrics and APM SaaS platform that ingests Kafka telemetry alongside the rest of your infrastructure. Teams sometimes evaluate Datadog as a replacement for a Kafka operations UI, which it is not designed to be.
Best for. Enterprises already standardised on Datadog for observability, where rolling Kafka metrics into the same alerting and correlation pane is worth the incremental cost. Always paired with a separate Kafka operations UI.
Strengths. Time-series metrics across brokers, topics, partitions, and JVM internals. Data Streams Monitoring for end-to-end latency and lag visualisation. Correlation with the rest of your infrastructure stack.
Limitations. Cannot browse messages, reset consumer offsets, manage Connect connectors, or view schema versions. JMX metrics beyond the curated 350-metric default count against per-host custom metric allotments at $5 per 100 metrics per month over allowance. For MSK, falls back to the lower-fidelity CloudWatch-based integration.
Set up and maintenance. SaaS with a Datadog Agent on every broker. Your operational overhead is agent deployment and dashboard maintenance.
Pricing. Per host plus custom metric overage plus the Data Streams Monitoring SKU. Costs scale significantly at large cluster sizes.
Chad Harris's take. The Datadog UI with its historical timeline is the best time navigator I’ve used. You can drag and drop in the timeline to zoom into a time range, and the time picker takes free text like now - 15m or last week.
 Rank 12
 Conduktor
conduktor.io
48 out of 70 Total
- Type
- Commercial UI + proxy
- Pricing
- $1,200 per seat per year (Team)
- Console needs
- Postgres, Cortex, Alertmanager
- Deployment complexity
- 3 out of 10
- Enterprise readiness ×3 weight, this criterion counts 3 times toward the total
- 10 out of 10
- Pricing model
- 3 out of 10
- Managed service compatibility
- 6 out of 10
- Monitoring scope
- 6 out of 10
Why these scores for Conduktor
- Deployment complexity 3 out of 10
- Console requires Postgres, Cortex and Alertmanager, ‘a multi-container stateful stack’, plus a Gateway layer in front of the brokers.
- Enterprise readiness 10 out of 10
- Gateway field-level encryption and guardrails ‘no UI-based tool can match’, on top of catalogs and approval workflows. Ties Kpow: the criterion’s four items are all met by both.
- Pricing model 3 out of 10
- Per seat, which the page says ‘penalises team growth’, plus separately licensed per-cluster Gateway; ‘licensing complexity is a recurring community complaint’.
- Managed service compatibility 6 out of 10
- This page names no MSK IAM or Glue support; several clusters from one Console on any distribution. FAQ: most tools treat MSK as secondary.
- Monitoring scope 6 out of 10
- Console covers monitoring, operations and governance, but the page names no per-partition lag, Connect or message inspection detail for it.
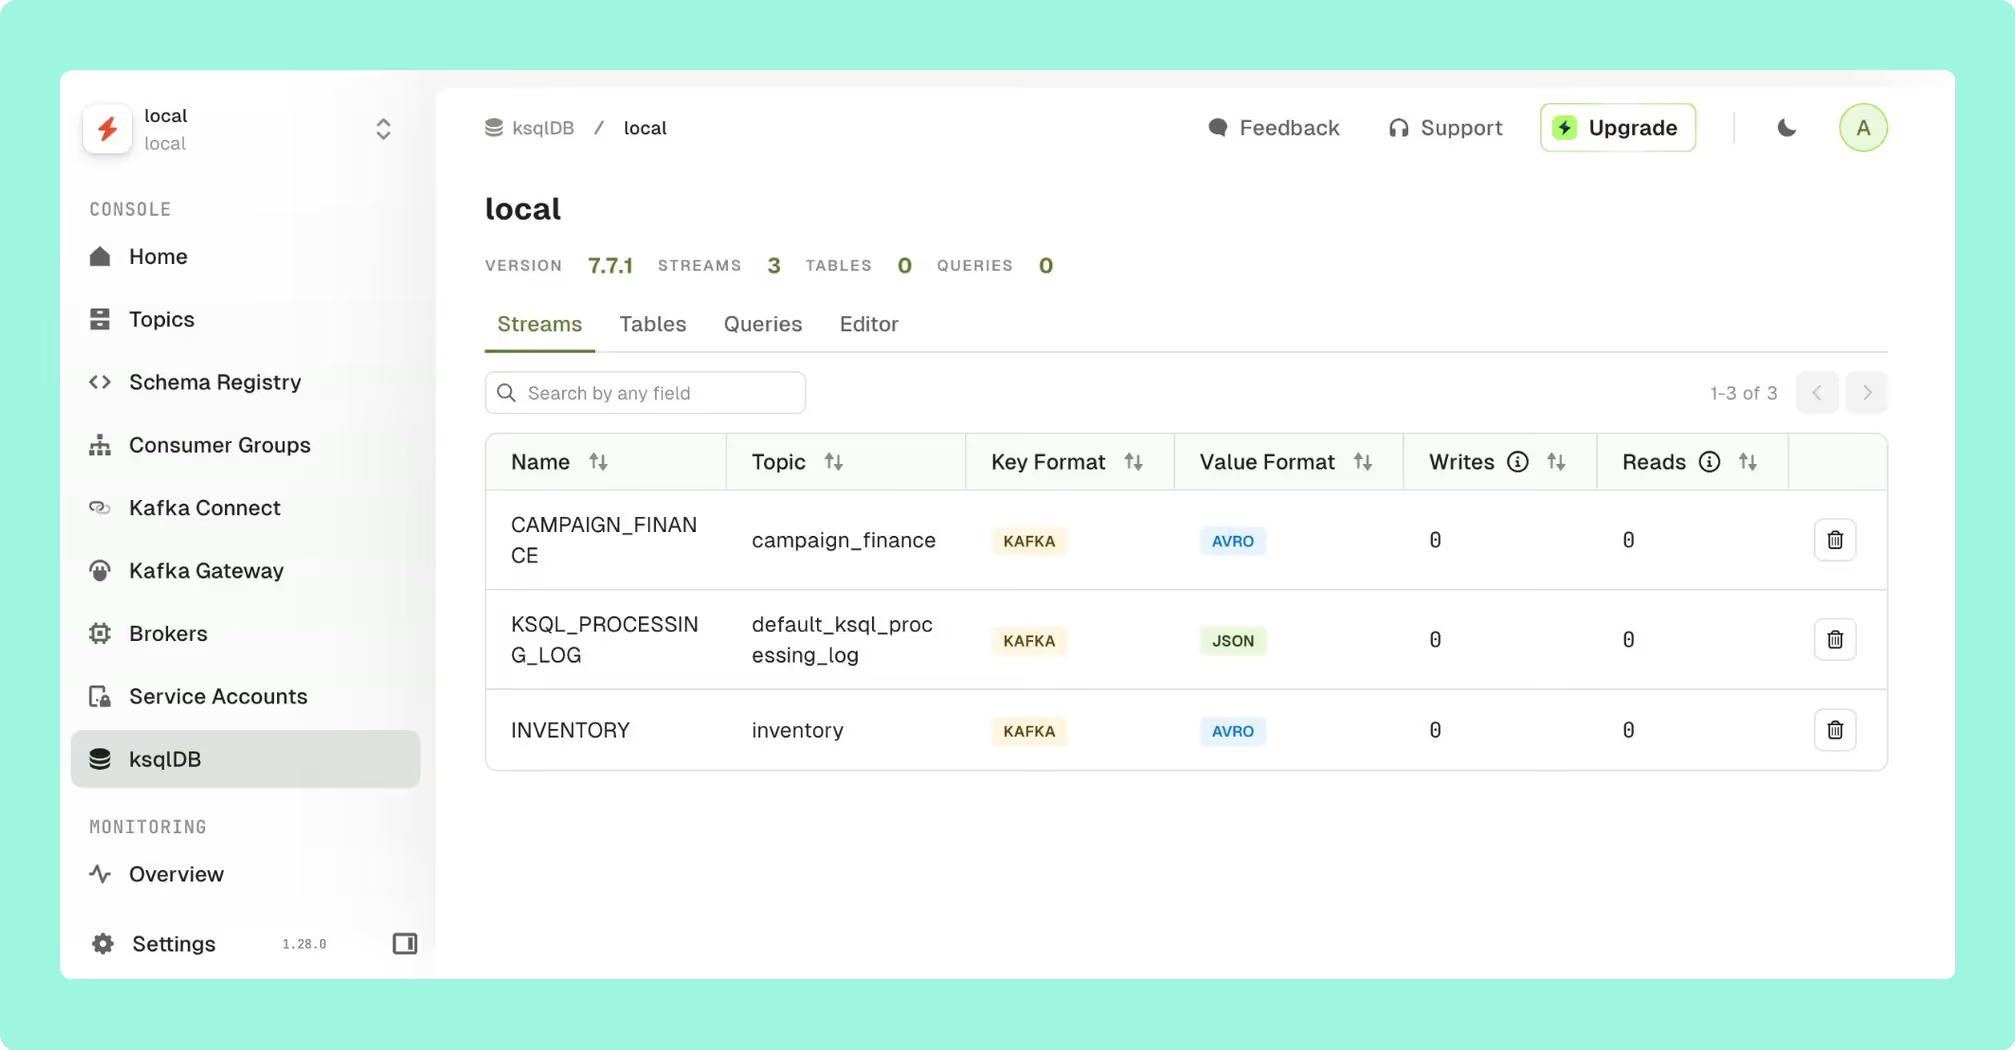
Overview. Conduktor is a commercial dual-layered platform: Conduktor Console (web UI for monitoring, operations, and governance) and Conduktor Gateway (a separately licensed wire-level Kafka proxy). If you’re evaluating it based on memory of the original free desktop tool, the product you find today is materially different and more expensive.
Best for. Mid-to-large enterprises that specifically need proxy-level enforcement across a large developer population, with an operations team capacity to run and maintain a Postgres-backed stack.
Strengths. Topic and application ownership catalogs, per-team self-service with approval workflows, and schema ownership tracking. The Gateway enables virtual clusters, field-level encryption, and guardrails that prevent non-compliant topic creation. No UI-based tool can match this layer of enforcement.
Limitations. The Console requires Postgres, Cortex, and Alertmanager: a multi-container stateful stack before you’ve monitored a single broker. Licensing complexity is a recurring community complaint: Community tier caps at 3 clusters and 50 users, Console Team Edition is priced per seat, and the Gateway is separately licensed with a 3-cluster minimum.
Set up and maintenance. Multi-container deployment requiring Postgres, Cortex, and Alertmanager. The Gateway adds another architectural layer in front of your brokers. Significant operational overhead.
Pricing. Console Team Edition is $1,200 per seat per year, or $125 per seat per month billed monthly, plus per-cluster Gateway licensing. Community tier free for up to 3 clusters and 50 users. Enterprise pricing via sales.
Compare Conduktor vs Confluent Control CenterConduktor vs LensesConduktor vs Redpanda ConsoleConduktor review
Kpow live demo
See monitoring alongside Kafka operations
Metrics matter when they lead to a clear next action. Explore Kpow in a live environment and connect consumer, topic, and cluster signals to the work your team actually performs.
For platform and SRE teams responsible for production Kafka.
Try the Kpow demoBest free Kafka monitoring tool
Kpow Community Edition is the strongest free option for teams running a Kafka deployment. It runs the same codebase as the commercial product (stateless single container, full message inspection with kJQ filtering, multi-cluster support) with a limit of 3 clusters. You evaluate real enterprise functionality without a time limit, then move to a paid license when you outgrow the cluster limit or need governance features like RBAC and audit logging. Explore Kpow Community Edition.
For teams that need a free tool with no production restrictions, AKHQ is the most mature open-source option, with broad feature coverage and a genuine auth story via OIDC and LDAP. As a third pick, Kafka UI by Provectus is the easier starting point if you need quick topic visibility and don’t require auth or multi-cluster support.
For a full breakdown of every free tier’s limits, features, and upgrade costs, including Conduktor and Lenses, see the best free Kafka UI tools comparison.
Most Kafka observability setups rely on JMX metrics. They're broker-centric. They tell you about the JVM and the infrastructure, but they don't give you the Kafka-specific telemetry you actually need when something goes wrong: consumer lag by group, topic throughput, partition-level offsets, connector state.
Derek Troy-West, Co-founder and CEO of Factor House
Best open-source Kafka monitoring tools
AKHQ is the most mature and complete free open-source option. Its YAML-based configuration, multi-cluster support, and auth backends (LDAP, OIDC, JWT) go meaningfully further than most free alternatives, making it a genuine fit for GitOps-oriented teams in non-regulated environments.
For metrics specifically, Kminion is the best open-source Prometheus exporter for consumer group lag detail, and pairs well with Grafana for teams building a metrics substrate from scratch. Use both together if your priority is a fully free, instrumented, alerting-capable stack, then layer a UI on top as your requirements grow.
Key considerations when choosing
Deployment complexity
The monitoring tool should not require more infrastructure than the Kafka cluster it monitors. Count every hard dependency (Postgres, Redis, Cortex, RocksDB, per-broker agent) as a separate operational liability with its own upgrade path, backup regime, and failure mode.
Enterprise readiness
For regulated environments, the requirements are specific: RBAC, SSO (OIDC/SAML/LDAP), a user-action audit log you can ship to a SIEM, and server-side data masking that prevents PII from reaching the browser. Client-side masking does not satisfy compliance requirements. Anything less shifts risk onto your team.
Pricing model
Per-seat pricing penalises team growth. Per-host or per-broker pricing penalises horizontal scaling. Per-cluster pricing is the most predictable model for most platform teams. Factor engineering maintenance hours into the total cost of open-source options, because with maintenance included they are not always the cheaper choice.
Managed service compatibility
MSK with IAM authentication, Confluent Cloud, Aiven, Redpanda, and Strimzi all have different auth and metadata behaviour. Verify support against your actual production topology. Specifically test MSK IAM auth and AWS Glue Schema Registry if your stack includes them. Many tools claim compatibility but treat both as secondary integrations.
Monitoring scope
Broker metrics are necessary but not sufficient. The broker metrics themselves, and the thresholds to alert on, are covered in Kafka broker monitoring, and the tools compared on broker signals alone are in Best tools to monitor Kafka broker health. Ensure the tool covers per-partition consumer lag, Schema Registry visibility, Kafka Connect management, and message inspection with native deserialization. If you are running Kafka Streams or Flink jobs, confirm topology visibility before committing.
Chad Harris’s take: Most teams have consumer lag, broker CPU and memory, some network throughput and under-replicated partitions. Those tell you that something is wrong; they won’t tell you why. In one incident I describe in my talk on Kafka operational issues, the missing signal was consumer group membership size: we had 39,000 idle members, then 79,000 after a hotfix doubled the service instances, and no alerts on coordinator request rates. Nothing in the dashboards pointed at the consumer groups, and it took a vendor support case to find it.
FAQ
What is the best Kafka monitoring tool for production use?
Kpow by Factor House is the strongest all-round choice: stateless deployment, enterprise RBAC and SSO, server-side data masking, multi-cluster support, and per-cluster pricing. For open-source-only environments, AKHQ is the most complete free option.
What is the best free Kafka monitoring tool?
Kpow Community Edition offers the most functionality without a license fee: same codebase as the commercial product, limited to 3 clusters. For unlimited free options, AKHQ is the most mature open-source pick.
Can I monitor Kafka consumer lag without a UI?
Yes. Kpow continuously collects Kafka telemetry, including per-consumer-group and per-partition lag, and emits it as a data stream you can route to any observability system. Whether you’re running Prometheus, Datadog, Grafana, or a custom alerting stack, you can consume Kpow’s metrics directly without needing a separate lag-monitoring tool or a dedicated UI.
Product demo · 6 min
Apache Kafka consumer group monitoring & lag: Kpow demo
Chad Harris walks through consumer group monitoring in Kpow: tracking group stability over time, breaking lag down to the partition level, safely resetting or skipping offsets on a running group, and using group topology to trace lag back to a host or topic.
Does Confluent Control Center work with MSK or self-managed Kafka?
No, not meaningfully. Control Center is built for Confluent Platform and loses most of its value outside that context. For mixed-broker or multi-cloud Kafka fleets, you need a vendor-agnostic tool.
How do I monitor Kafka in a regulated environment?
You need server-side data masking, RBAC, SSO, and a user-action audit log shippable to your SIEM. Kpow covers all of these from a single stateless container, with no secondary database required. Verify that any tool you evaluate masks data server-side, not in the browser.
What Kafka monitoring tool works best with AWS MSK?
Kpow provides first-class MSK IAM authentication and native AWS Glue Schema Registry support. Most tools treat MSK as a secondary integration or lack IAM auth support entirely. Test both explicitly during any PoC against an MSK cluster.
For the rest of the tooling landscape, see the complete guide to Kafka.
How these tools were scored
Every option is scored from 0 to 10 on each criterion, from the evidence and sources this page cites, and the reason for each score is on its card. The criteria are weighted: Deployment complexity counts once, Enterprise readiness counts three times, Pricing model counts once, Managed service compatibility counts once and Monitoring scope counts once, for a total out of 70. Enterprise readiness counts three times here, because access control, audit and somebody accountable for a fix are what decide whether a monitoring tool can be handed to more than the specialists who built it. Deployment complexity, pricing model, managed service compatibility and monitoring scope count once. This page is published by Factor House, which makes Kpow. Every option is scored on the same rubric and the same sources: Kpow's per-criterion scores are set the same way as every other option's and are not adjusted, and the weights apply to every option alike. Kpow ranks first on its total of 67 out of 70. The other options follow by total. Conduktor is listed last whatever its total; on its total of 48 it would place second.