
Kafka dashboard: the features that matter in production
Table of contents


Running Apache Kafka in production means managing distributed state across brokers, topics, partitions, and consumer groups at the same time. A Kafka dashboard gives you a single interface to observe that state in real time, without assembling metrics by hand or reaching for the CLI every time something looks wrong. This article covers what a production-grade Kafka dashboard should do, what to look for when evaluating one, and how Kpow by Factor House approaches the problem.
What is a Kafka dashboard?
A Kafka dashboard is a web interface that aggregates and visualises the operational state of an Apache Kafka cluster. It typically displays broker health, consumer group lag, partition assignments, topic throughput, and schema registry state, giving platform and data engineering teams a shared view of a cluster without running CLI commands manually.
Most CLI tools surface a snapshot of a single metric at a time. A Kafka dashboard aggregates across brokers and topics, renders trends over time, and makes cluster state readable to anyone on the team, not just whoever knows the right kafka-consumer-groups.sh flags. At the partition level, that difference matters: a group-level lag summary can look acceptable while a single partition is falling badly behind.
A Kafka dashboard typically visualises:
- Broker health and JVM metrics
- Consumer group lag, by topic and by partition
- Partition assignments and ISR (in-sync replica) state
- Topic throughput in messages and bytes per second
- Schema registry contents and schema evolution state

Why Kafka is hard to observe
Kafka's architecture makes operational visibility harder than it initially appears. A healthy cluster requires every broker to agree on partition leadership, maintain replication, and serve consumers at acceptable latency simultaneously. When something is off, the symptom and the cause are often in different parts of the cluster.
Consumer lag is a particular challenge. It is a lagging indicator by nature: by the time lag accumulates to a level that looks alarming at the group level, the relevant consumer may already be hours behind on specific partitions. Without partition-level visibility, you are watching an average that conceals the problem.
Schema evolution adds another layer. When a producer changes a schema and a downstream consumer has not been updated, you may not see an error until records hit the consumer's deserialiser. A dashboard with schema registry integration makes this state visible before it causes failures.
At scale, manual inspection becomes impractical. A cluster with hundreds of topics, multiple consumer groups, and several environments cannot be monitored with periodic CLI snapshots. Production operations require continuous, aggregated visibility.
What to look for in a Kafka dashboard
Not all Kafka dashboards are built for production use. Some are read-only tools useful in development. Others surface cluster-level metrics but lose detail at the partition level, which is exactly where most operational problems hide. When evaluating options, the following criteria are worth assessing carefully.
Real-time lag visibility at the partition level. Group-level lag summaries are a useful starting point, but they are not sufficient for production. A partition within a topic can be stalled while others process normally, and a group-level average will not surface it. A production-grade dashboard shows lag per partition, updates continuously, and lets you drill from the group view to individual partitions without switching tools.
Consumer group inspection and offset management. Beyond observing lag, your team needs to act on it. That means being able to inspect individual consumer group members, see their partition assignments, and when necessary, reset or adjust offsets directly from the UI. Without this, offset management defaults back to the CLI, with all the access-control and audit implications that involves.
Broker and partition health metrics. Broker health goes beyond whether a broker is reachable. Under-replicated partitions, ISR changes, and leader imbalances are the early signals of instability. A dashboard should surface these alongside the topics and partitions affected, not just a raw count.
Multi-cluster support. Platform teams routinely manage separate clusters for development, staging, and production. A dashboard that requires a separate deployment per cluster, or cannot aggregate views across environments, creates avoidable operational overhead.
Schema Registry integration. For teams using Avro, Protobuf, or JSON Schema, the registry is a critical part of the pipeline. A dashboard that integrates schema registry state lets you see which schemas are in use, view historical versions, and spot compatibility issues before they reach consumers.
RBAC and access control. Not everyone who needs to view the Kafka dashboard should be able to reset offsets or modify topic configuration. Role-based access control lets you assign permissions at the operation level, per team. Without it, you are typically choosing between open access and restricted access, with nothing in between. In regulated environments, audit logging matters equally: a record of who did what, and when, is often a compliance requirement rather than a convenience.
Operational simplicity. A monitoring tool that is itself hard to maintain creates a different kind of overhead. Deployment model, configuration surface area, and the number of external dependencies all affect how much engineering time the dashboard consumes. The simpler the deployment, the less cognitive load it adds.
Kpow is built to meet these criteria without requiring significant configuration effort or ongoing maintenance.
Kpow: a Kafka dashboard for production environments
Kpow is a Kafka dashboard built by Factor House. It deploys inside your own infrastructure as a single stateless JVM container, connects directly to your Kafka cluster, and requires no external data transmission. Cluster data stays within your environment.
The deployment model is deliberate. For teams in regulated industries or with strict data residency requirements, sending cluster telemetry to an external SaaS platform is not always acceptable. Kpow runs on-premises, in a Docker container, in a Kubernetes pod, or on any JVM-compatible host, wherever your Kafka cluster lives.
It is designed for teams running Kafka seriously in production: platform engineers managing multiple clusters, data engineering teams that need reliable observability without assembling it from individual components, and organisations that require audit logging and access control as part of their compliance posture.
Core features of Kpow's Kafka dashboard
Real-time consumer lag visibility. Kpow surfaces lag at the partition level, not just the consumer group level. From the consumer groups view, you can drill from a group summary to individual partitions in a few clicks, seeing current offset, log end offset, and lag count per partition as they update. For teams managing high-throughput pipelines, the difference between group-level and partition-level visibility is often the difference between catching a stalled consumer early and discovering it after records have accumulated for hours.
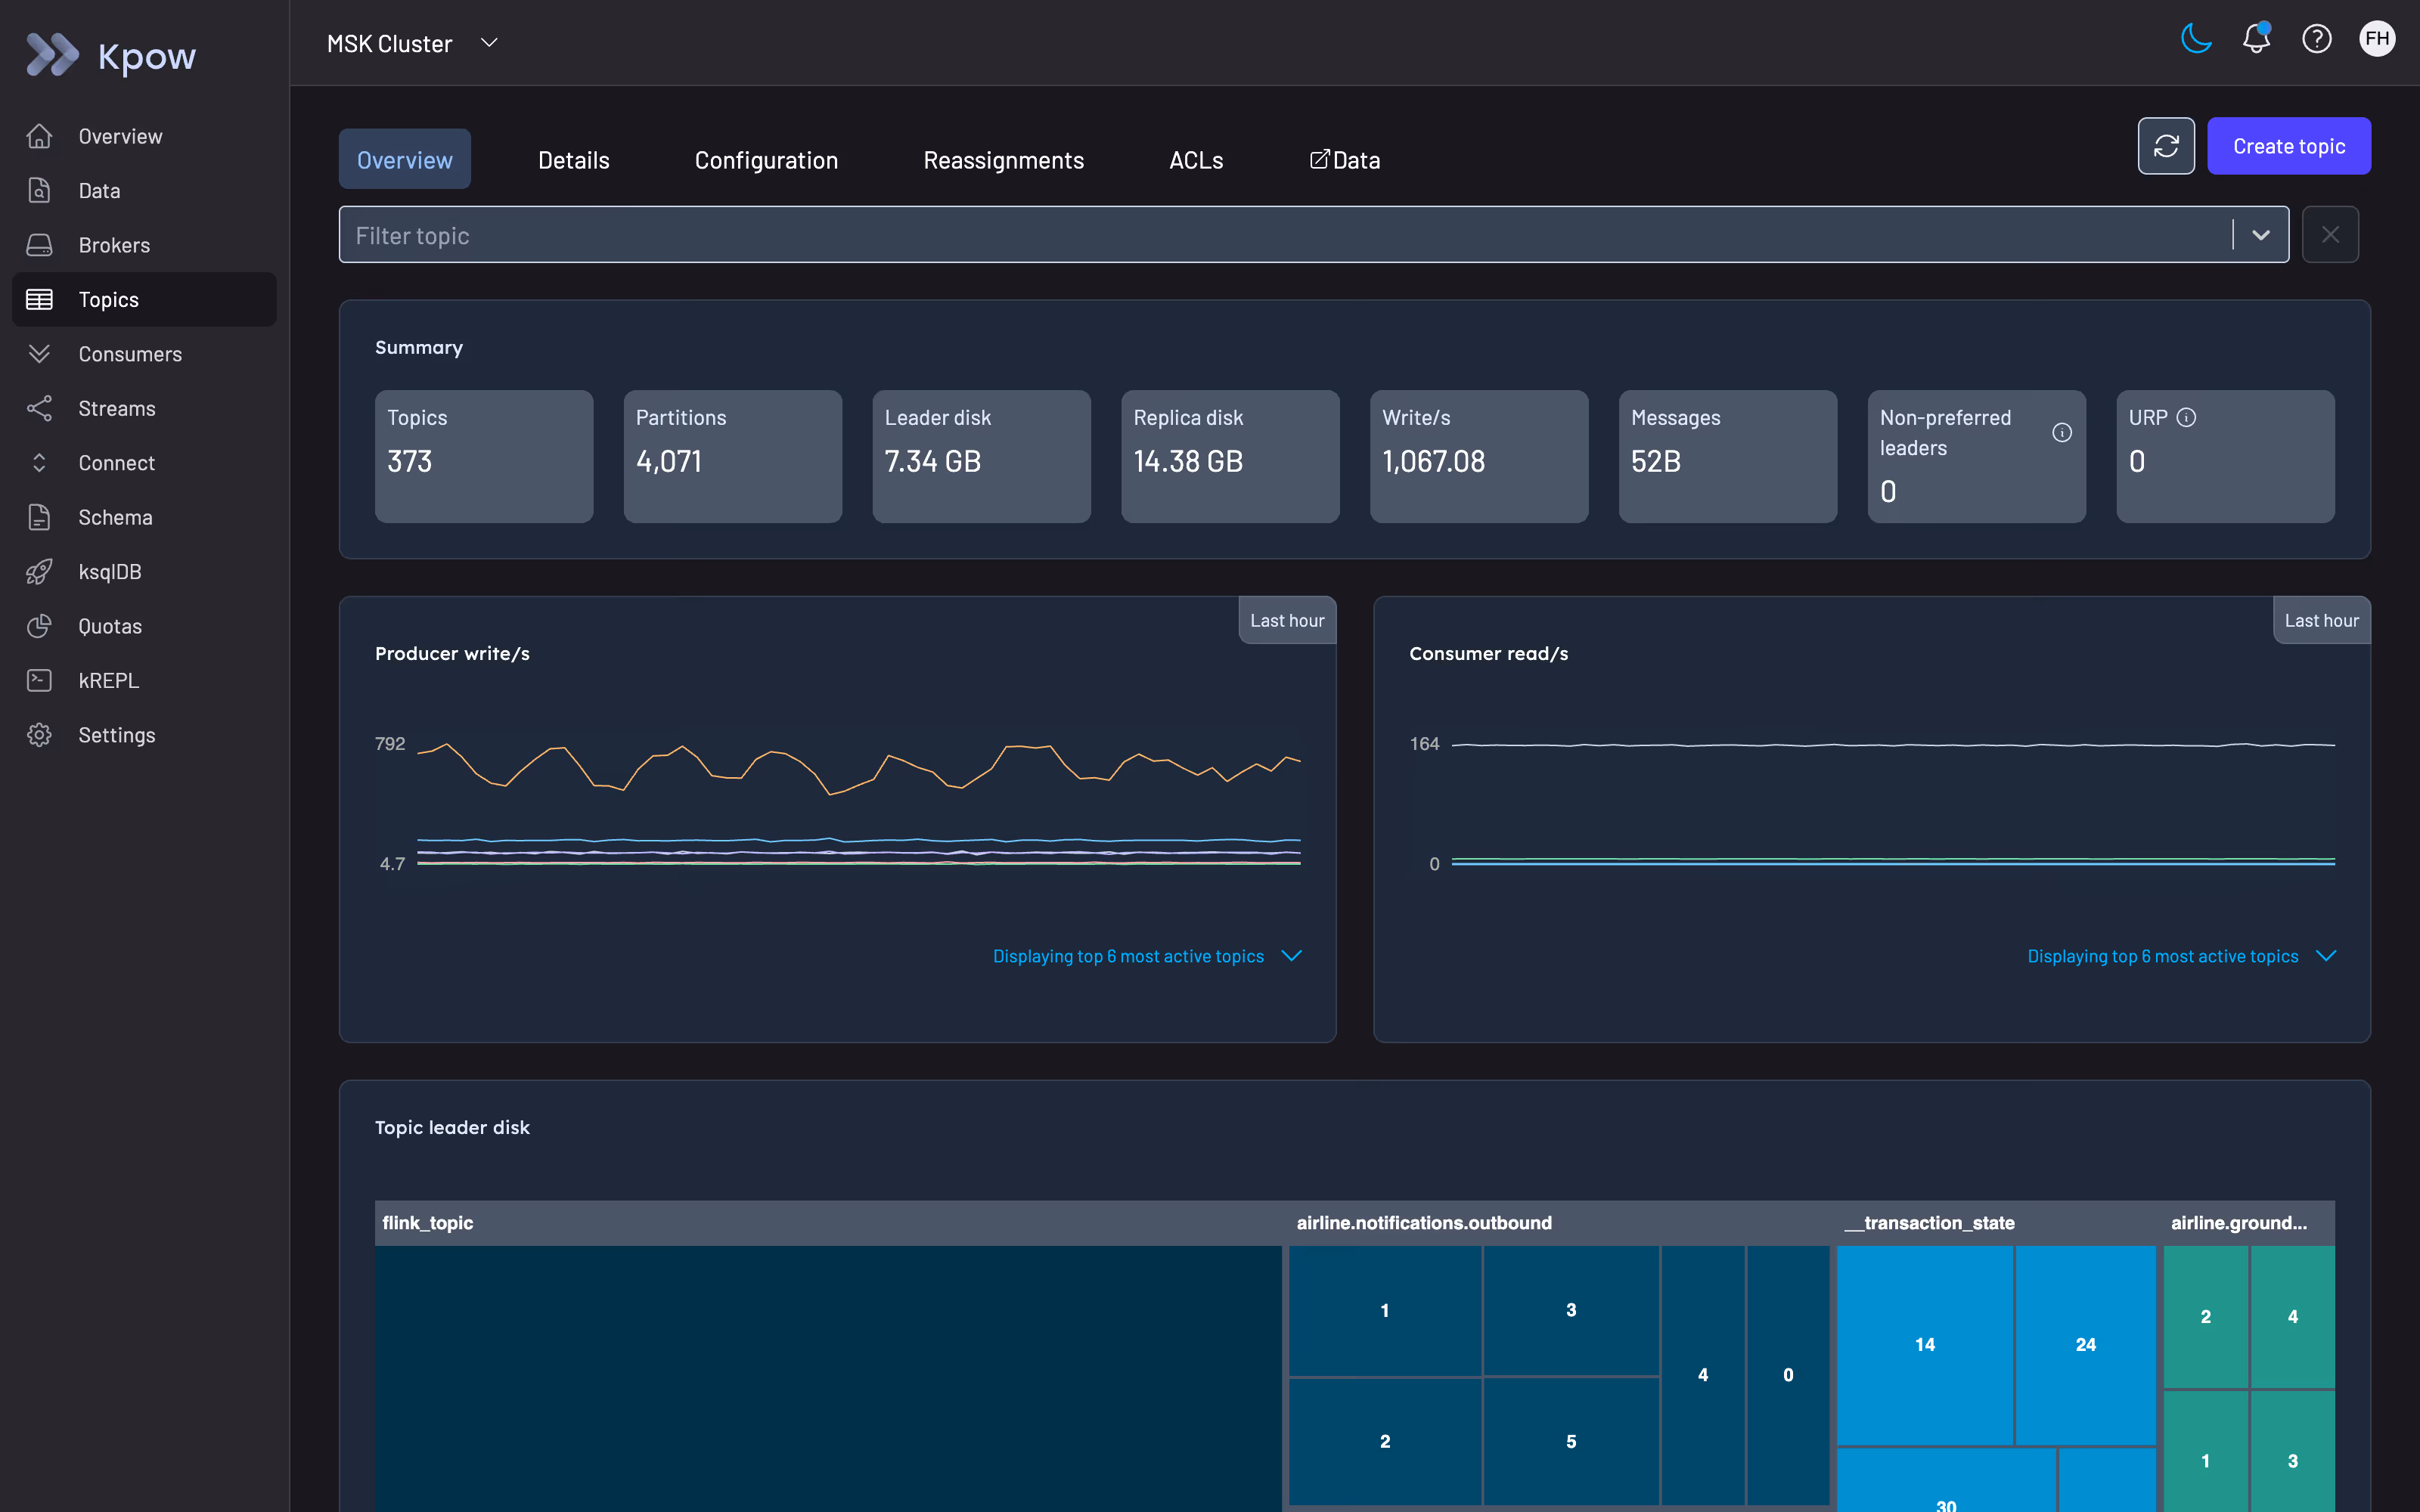
Broker and cluster health. The broker view surfaces JVM metrics alongside Kafka-specific health indicators: under-replicated partition counts, ISR state, and leader distribution across the cluster. Leader imbalance is a common source of uneven load in large clusters and is difficult to detect without partition-level visibility. Kpow aggregates this state without requiring a separate JMX exporter or Prometheus pipeline.
Topic and partition management. From the Kpow UI you can inspect topic configuration, view partition assignments, create new topics, and modify configuration without leaving the dashboard. Partition-level inspection shows which brokers hold which replicas and the current replication state, which is useful when investigating ISR issues or planning rebalancing operations.
Consumer group inspection and offset management. Kpow lets you inspect the current state of any consumer group: member assignments, partition ownership, current and committed offsets, and group coordinator. When you need to reset offsets, the operation is performed through the UI and recorded in the audit log, keeping offset management accessible to authorised users without requiring CLI access to the cluster.
Schema Registry integration. Kpow integrates with Confluent Schema Registry, exposing schema subjects, versions, and compatibility settings directly in the dashboard. Teams using Avro, Protobuf, or JSON Schema can browse schemas and view historical versions without switching to a separate tool. Schema Registry visibility is useful when debugging serialisation errors or planning schema evolution.
Multi-cluster support. A single Kpow deployment can connect to multiple Kafka clusters, including self-managed brokers and managed services such as Amazon MSK, Confluent Cloud, Redpanda, Aiven, StreamNative, Google Cloud Managed Kafka, NetApp Instaclustr, and Oracle Cloud. Each cluster appears under its own namespace in the UI with independent access control configuration. For platform teams managing several environments, this eliminates separate dashboard deployments per cluster and simplifies access management.
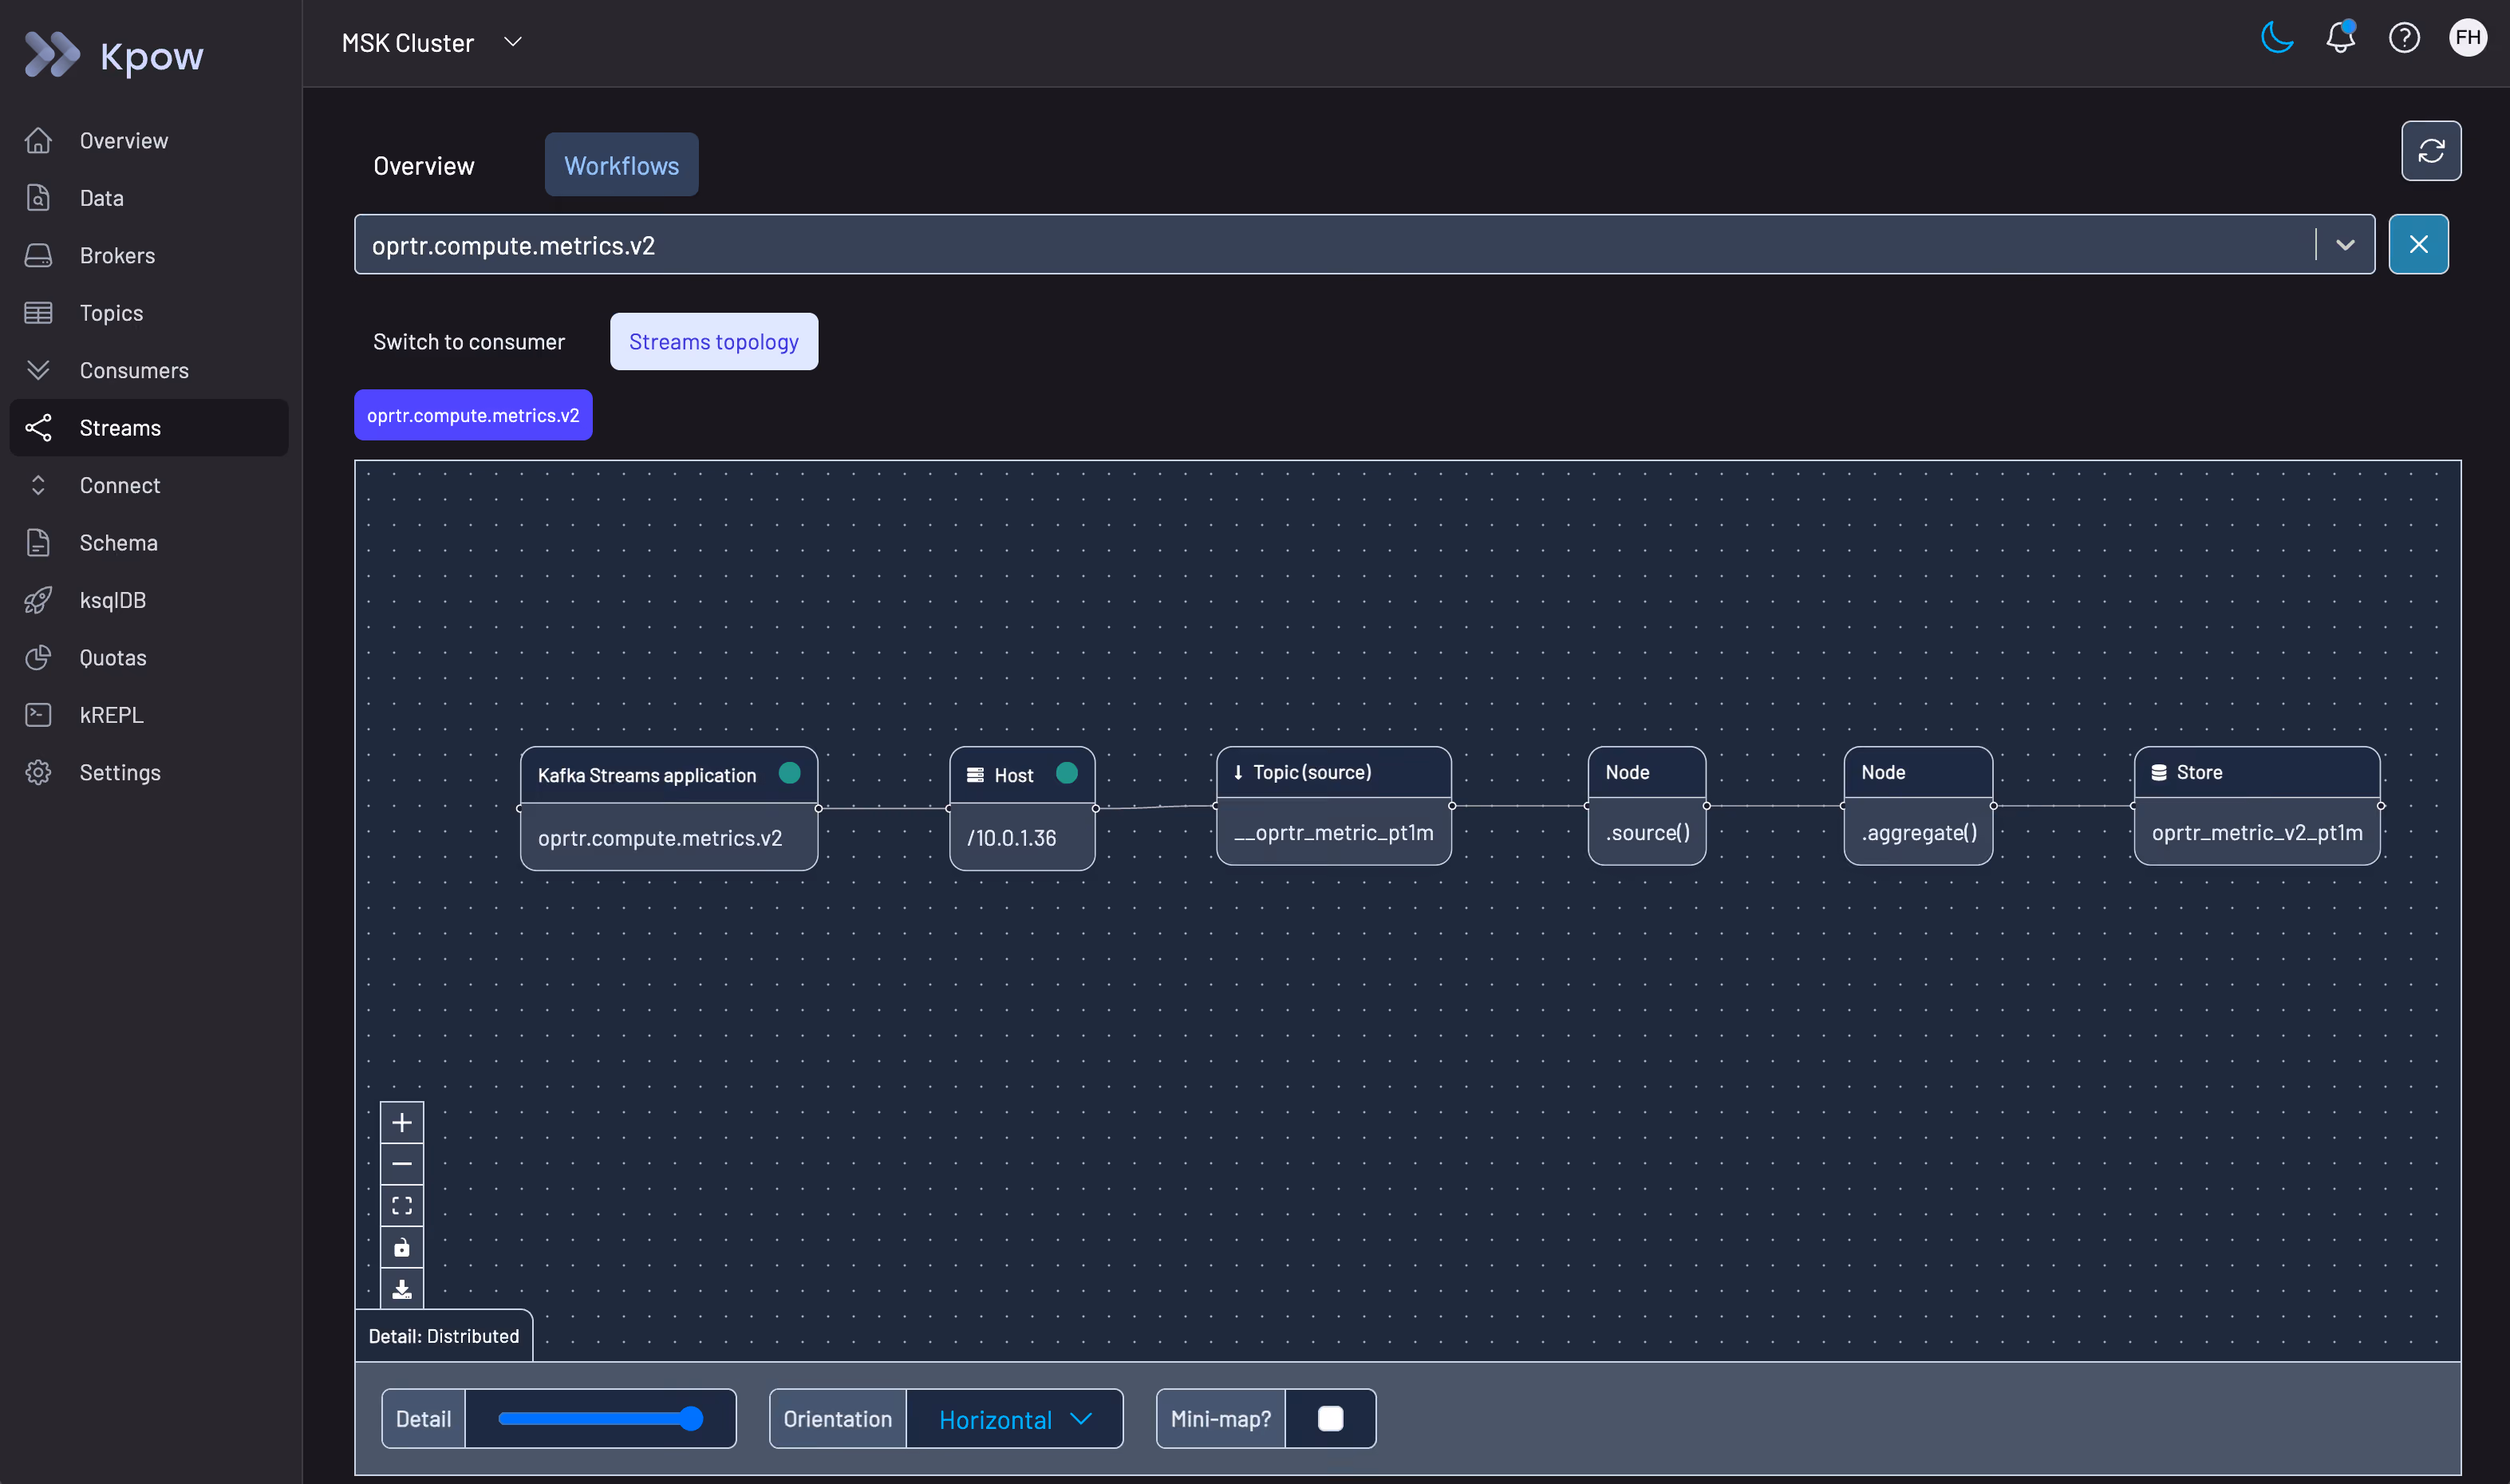
Kafka Streams and Kafka Connect. Kpow extends beyond core Kafka to cover the wider ecosystem. For teams using Kafka Streams, it surfaces stream topology state and task assignments. For teams using Kafka Connect, it shows connector state, task status, and configuration. Both are surfaces that are typically invisible in basic monitoring setups and that matter when debugging data pipeline failures.
Kpow vs open-source alternatives
The most common alternatives to Kpow are AKHQ, CMAK, and a DIY stack built on Grafana, Prometheus, and JMX exporters. Each has a legitimate use case, but the trade-offs become significant as production requirements grow.
AKHQ (v0.27.0, March 2025) is a capable open-source Kafka dashboard with topic browsing, consumer group inspection, and schema registry integration. It includes role-based access control with LDAP and OIDC integration, but the implementation has notable limits in production: there is no audit logging, no native data masking, and fine-grained multi-cluster RBAC requires additional configuration effort. For teams with compliance requirements around PII, HIPAA, PCI-DSS, or GDPR, these gaps are significant. AKHQ also has no commercial support, which means issue resolution depends on the open-source community and project maintainers.
Kafdrop (v4.2.0, July 2025) is a lightweight Kafka UI suited to development environments and ad-hoc inspection. It displays topic metadata, partition assignments, and message content, but it does not support consumer group offset reset, has no access control, and provides no audit trail. The project itself describes Kafdrop as a developer tool rather than team infrastructure. Most teams use it for local development convenience and look for something more capable in production.
Grafana with Prometheus and JMX exporters can surface Kafka broker metrics effectively, but it is a metrics pipeline, not a Kafka management tool. Setting it up requires configuring the JMX exporter per broker, writing or importing dashboard JSON, and managing the Prometheus scrape configuration. It provides no topic management, no offset manipulation, and no consumer group inspection. Keeping the JMX dashboards accurate as the cluster changes is also ongoing work. The result is a metrics view rather than a Kafka dashboard in the operational sense.
The core trade-off with open-source options is engineering time. The tooling is free, but configuring it, maintaining it, and covering the gaps around access control and audit logging is not. Kpow is a commercial product that runs out of the box and includes the capabilities that open-source alternatives require significant effort to approximate or cannot provide at all.
Who uses Kpow and when
Platform and infrastructure teams managing multiple environments. When a team is responsible for several Kafka clusters across development, staging, and production, operational overhead compounds quickly. Kpow's multi-cluster support and centralised access control reduce the surface area they need to manage.
Engineering teams in regulated industries. Finance, healthcare, and government organisations often need audit logging and RBAC as part of their compliance posture, not as optional extras. Kpow provides both out of the box, deployed entirely within the organisation's own infrastructure, with no data leaving the environment.
Development teams who need faster feedback. Even outside production, a team building against Kafka benefits from being able to inspect consumer groups, view messages, and confirm schema compatibility without reaching for the CLI. Kpow is fast to deploy in a development environment and straightforward enough that its value is immediate.
Getting started with Kpow
Kpow connects to any Kafka cluster via standard bootstrap properties. It deploys as a Docker container, a JAR, or via Helm chart, and can be running against your cluster in a few minutes. There is no agent to install on your brokers, and no cluster data leaves your environment.
You can try Kpow with a free 30-day trial. If you want to see it against your own cluster before committing, a guided demo is also available.
FAQ
What is a Kafka dashboard?
A Kafka dashboard is a web interface that aggregates and visualises the operational state of an Apache Kafka cluster. It typically displays broker health, consumer group lag, partition assignments, topic throughput, and schema registry state, giving platform and data engineering teams a single view of a cluster without running CLI commands manually.
What metrics should a Kafka dashboard show?
A production-grade Kafka dashboard should display consumer group lag by topic and partition, broker health and JVM metrics, under-replicated partition count, ISR state, topic throughput in messages and bytes per second, and consumer group member state. Partition-level detail is important: group-level summaries alone can mask significant lag in specific partitions.
Can I use Grafana as a Kafka dashboard?
Grafana combined with JMX exporters and Prometheus can surface Kafka broker metrics, but it requires significant setup: you need to configure the JMX exporter per broker, write or import dashboard JSON, and manage the Prometheus scrape pipeline. It also provides no topic management, offset manipulation, or consumer group inspection. For a team that needs both metrics and management, Grafana covers one part of the picture rather than acting as a complete Kafka dashboard.
Is there a free Kafka dashboard?
Several open-source Kafka dashboards are available at no cost. AKHQ and Kafdrop are the most widely used. Both offer topic browsing and consumer group inspection. AKHQ includes partial RBAC via LDAP and OIDC integration; Kafdrop has no access control at all. Neither provides audit logging, which is a common requirement in regulated environments.
How do I monitor Kafka consumer lag?
Consumer lag in Kafka is the difference between the latest offset produced to a partition and the last offset committed by a consumer group. You can check it with kafka-consumer-groups.sh --describe for a point-in-time snapshot, or use a dashboard that polls __consumer_offsets and surfaces lag per partition continuously. Partition-level visibility is what distinguishes a production-grade dashboard from basic tooling: group-level averages can look acceptable while individual partitions fall significantly behind.
What is the difference between a Kafka dashboard and Kafka monitoring?
Kafka monitoring is the broader practice of collecting, alerting on, and analysing Kafka metrics, often using Prometheus, Grafana, or a commercial observability platform. A Kafka dashboard adds interactive management: browsing topics, inspecting consumer groups, managing offsets, and viewing schemas. Most Kafka dashboards include monitoring views; most monitoring tools do not include management capabilities.
How does Kpow compare to AKHQ?
Kpow is a commercial Kafka dashboard with RBAC, audit logging, multi-cluster support, and Kafka Streams and Connect visibility built in. AKHQ is an open-source alternative with strong topic and consumer group browsing and some RBAC via LDAP and OIDC, but no audit logging and limited fine-grained access control in multi-cluster environments. The main trade-off is operational overhead: AKHQ requires more configuration and ongoing maintenance; Kpow is designed to run in production without significant setup.
Does Kpow support Confluent Cloud and Amazon MSK?
Yes. Kpow supports a range of managed Kafka services including Amazon MSK, Confluent Cloud, Redpanda, Aiven, StreamNative, Google Cloud Managed Kafka, NetApp Instaclustr, and Oracle Cloud. Connection is configured via standard Kafka bootstrap properties. Check the Kpow documentation for any provider-specific configuration notes.
What is the best Kafka monitoring tool?
The right tool depends on your requirements. For teams that need metrics only, Prometheus with JMX exporters and Grafana is a common open-source approach. For teams that need management capabilities, RBAC, audit logging, and cross-cluster visibility in a single product, a dedicated Kafka dashboard like Kpow is a better fit. Open-source tools like AKHQ or Kafdrop suit development environments or smaller teams with lower compliance requirements.
How do I visualise Kafka consumer groups?
Consumer group state can be viewed with kafka-consumer-groups.sh --describe, which shows lag, current offset, log end offset, and consumer ID per partition. A Kafka dashboard goes further: it shows group state (stable, rebalancing, empty), member assignments per partition, and real-time lag trends, making it easier to spot rebalancing storms or stalled consumers without scripting or periodic manual checks.
Is Kpow a Kafka dashboard?
Yes. Kpow is a Kafka dashboard built by Factor House. It provides real-time visibility into broker health, consumer lag, topic and partition state, schema registry, Kafka Streams, and Kafka Connect, all from a single UI deployed within your own infrastructure.