Overview
In Part 1 of our observability series, we demonstrated how to close the Context Gap using Kpow’s unified diagnostic interface. Resolving active incidents quickly is crucial, but mature engineering teams also require robust historical analysis, capacity planning, and automated alerting. For these tasks, teams rely on monitoring stacks like Prometheus and Grafana.
However, standard Kafka dashboards frequently suffer from a persistent issue known as the Quality Gap. They are flooded with raw, low-level metrics that provide technical depth but lack the context required to understand true business impact.
This guide explores how to close the Quality Gap by transitioning from scraping low-level infrastructure data to utilizing high-fidelity, pre-calculated telemetry that instantly reveals environment health.
This is Part 2 of the Kafka Observability with Kpow: Driving Operational Excellence series.
- Part 1: Rapid Kafka Diagnostics: A Unified Workflow for Root Cause Analysis
- Part 2: Beyond JMX: Supercharging Grafana Dashboards with High-Fidelity Metrics (This article)
- Part 3: Operational Transparency: Real-Time Audit Trail integrated with Webhooks
About Factor House
Factor House is a leader in real-time data tooling, empowering engineers with innovative solutions for Apache Kafka® and Apache Flink®.
Our flagship product, Kpow for Apache Kafka, is the market-leading enterprise solution for Kafka management and monitoring.
Start your free 30-day trial or explore our live multi-cluster demo environment to see Kpow in action.
Problem: Quality Gap of Raw Metrics
The standard approach for routing Kafka metrics into Prometheus is to deploy a JMX Exporter. While this successfully moves data from the broker to the dashboard, it creates a significant Quality Gap.
Raw JMX metrics provide deep technical visibility but offer very little business context. Metrics such as raw message offsets or byte counters are difficult to interpret during a critical incident. They do not directly convey user impact or service degradation.
In practice, the most meaningful operational signals are derived metrics. For example, knowing a consumer’s exact lag reflects data freshness and downstream SLA risk. Knowing the active throughput delta of a topic indicates whether a producer has silently failed.
Attempting to compute these high-fidelity metrics from raw JMX offsets using PromQL is notoriously difficult, fragile, and often inaccurate. As a result, teams are left with noisy, low-quality dashboards that hinder incident response and make automated alerting unreliable.
Solution: Kpow as a High-Fidelity Telemetry Engine
Kpow eliminates the Quality Gap by acting as a centralized, high-fidelity metrics engine. The unique advantage of Kpow is that it calculates its own telemetry by directly observing your Kafka cluster and related resources.
This architectural choice provides several distinct advantages:
- No JMX Dependency: Because Kpow does not rely on Kafka’s internal JMX metrics, it offers frictionless installation and configuration. You do not need to deploy sidecars or manage complex regular expression filters. Instead, Kpow exposes several dedicated, OpenMetrics-compliant egress endpoints. You simply configure your Prometheus scraper to target specific paths, such as the core telemetry endpoint, topic offsets, or consumer group offsets, as detailed in the Prometheus Integration Overview.
- Derived, Actionable Metrics: Kpow handles the heavy computational lifting. From its direct observations, it calculates complex, derived metrics that represent true business impact. As outlined in the Kpow Metrics Glossary, these include precise consumer group lag (
group_offset_lag), production throughput rates (topic_end_delta), and under-replicated partition counts (topic_urp_total). These are exposed as clean, highly labeled time-series data ready for immediate visualization. - Unified Scope: This frictionless pattern extends beyond just Kafka brokers. Kpow automatically calculates and exposes metrics across your entire streaming ecosystem. With granular endpoint structures, you gain comprehensive observability into Kafka Connect, Schema Registry, Kafka Streams, and ksqlDB. This provides full-stack visibility without requiring additional agents or custom exporters.
Putting it into Practice: Ready-to-Use Grafana Dashboards
To demonstrate the power of high-fidelity telemetry, we have published four ready-to-use Grafana dashboard templates. These dashboards consume Kpow’s Prometheus endpoint to provide immediate, actionable visibility across your infrastructure.
You can instantly import these dashboards into your environment directly from the Grafana Community Gallery, or explore the source templates and setup instructions in our dedicated Factor Telemetry GitHub repository.
1. Kafka Environment Health
Designed for Platform Teams, this dashboard provides a high-level macro view of overall cluster stability and capacity.
Rather than relying on raw byte counts, it surfaces derived operational health indicators. It tracks total online brokers, overall data on disk, total topics, and total consumer groups. It also visualizes cluster-wide production and consumption rates, and provides a detailed breakdown of topic activity and consumer group health (Stable, Rebalancing, Empty) to give you an instant read on the environment’s status.
🌐 Import from Grafana Gallery (ID: 25103) | 📁 View JSON Template
2. Kafka Topic Diagnostics
Designed for data engineers and platform administrators, this dashboard provides granular visibility into the data layer.
It tracks aggregate metrics like total topics, total replica disk usage, cluster-wide read/write throughput, and non-preferred leaders. Most importantly, it visualizes per-topic production and consumption rates over time, topic size growth, and isolates the exact topics experiencing consumer lag or Under Replicated Partitions (URPs) through detailed diagnostic tables.
🌐 Import from Grafana Gallery (ID: 25104) | 📁 View JSON Template
3. Kafka Consumer Group Deep Dive
Designed for Application Teams, this dashboard focuses on micro-level Service Level Agreement (SLA) monitoring.
Instead of generic host metrics, it visualizes the exact state of your data consumption. Key metrics include precise total lag (group_offset_lag) and real-time consumption rates (group_offset_delta). It details total assigned members and hosts, and features a clear status table tracking the exact state of every consumer group to help engineers spot stalling applications before downstream users are impacted.
🌐 Import from Grafana Gallery (ID: 25105) | 📁 View JSON Template
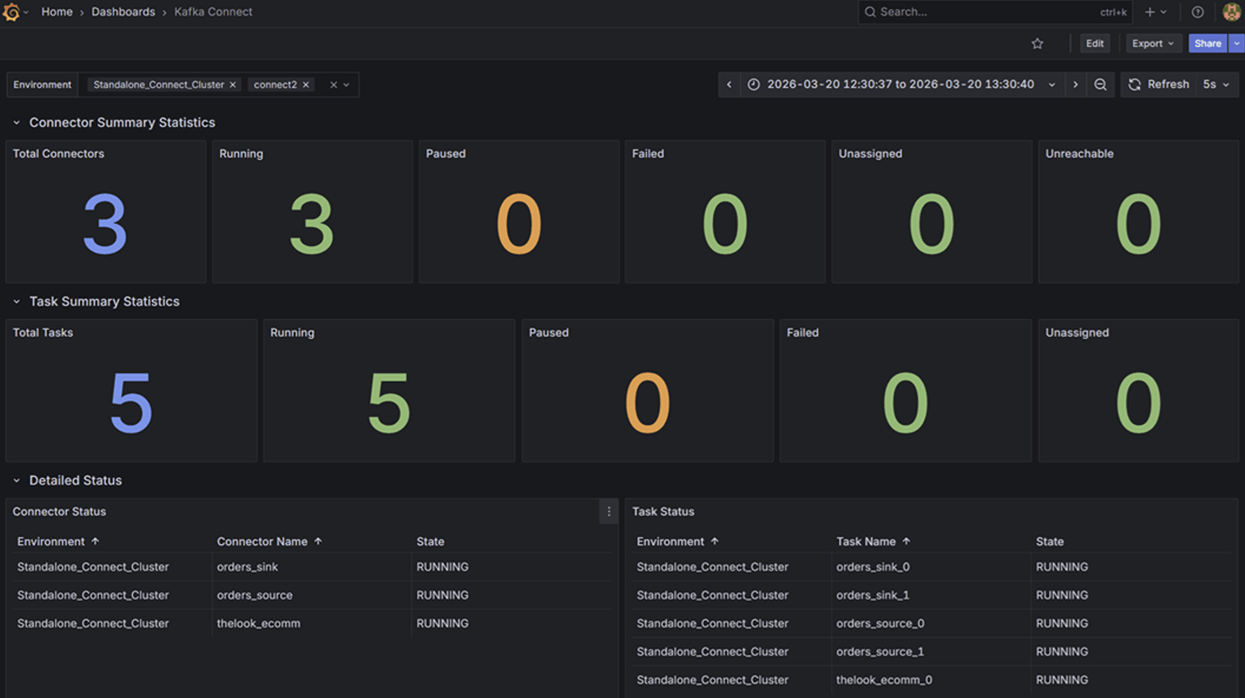
4. Kafka Connect Operations
Data pipeline reliability depends heavily on integration health. This dashboard targets Kafka Connect deployments, replacing tedious API queries with instant visual feedback.
It tracks aggregate summary statistics alongside individual Connector and Task states. By mapping state labels directly to distinct visual alerts (RUNNING, PAUSED, FAILED, UNASSIGNED, UNREACHABLE), teams can immediately detect stalled integrations and isolate whether the failure exists at the connector or task level.
🌐 Import from Grafana Gallery (ID: 25106) | 📁 View JSON Template
Conclusion
Standard monitoring approaches leave teams struggling with noisy, low-level data. This Quality Gap makes historical analysis difficult and accurate alerting nearly impossible.
By bypassing raw JMX metrics and leveraging Kpow’s self-calculated telemetry, you can instantly upgrade your Grafana dashboards with high-fidelity, actionable insights. This approach provides frictionless installation while delivering precise business context across Kafka, Kafka Connect, Schema Registry, and ksqlDB.
With real-time diagnostics and high-fidelity metrics established, the final step to operational maturity is administrative accountability. In Part 3: Operational Transparency, we will demonstrate how to close the Governance Gap by streaming Kpow’s real-time audit trail directly into your team’s communication channels via Kpow’s webhook integration.
Next steps
Explore Kpow in your own environment with a free 30-day trial.
If you need assistance managing your Kafka environment, reach out to our engineering support team at [email protected].