A Kafka UI is a web-based interface that sits on top of an Apache Kafka cluster and turns the broker, topic, partition, and consumer-group APIs into something you can read and operate from a browser. The CLI tools shipped with Kafka are sufficient when you run a handful of topics on a single cluster. They become a friction point as soon as several teams share the platform, when operators need a consistent view across environments, or when an incident requires you to inspect partition state in seconds rather than minutes.
If you are looking for kafka-ui, the open-source project first published on GitHub by Provectus: it continues as Kafbat UI, maintained by the same core community, and it is one of the tools compared below. On this page’s rubric Kpow ranks first for teams that need single sign-on, role-based access and an audit log, while Kafbat UI and AKHQ are the free choices.
To get a sense of the operational surface area a Kafka UI has to cover at the upper end, JPMorgan runs 102 clusters with around 510 nodes and 13,000 topics, ingesting roughly 400 billion events per day. At that scale, the difference between a UI that surfaces under-replicated partitions clearly and one that forces an operator back to kafka-topics.sh is the difference between a five-minute fix and a thirty-minute incident.
This guide is written for platform and data engineers evaluating which Kafka UI to standardise on. It covers what a Kafka UI does, how the market is segmented, the criteria worth weighing during evaluation, and how the major tools compare in practice.
At a glance
Eight options are scored here on this page's five weighted criteria, 90 points in all. The rubric is weighted: Support and maintenance counts three times, Access control and audit counts three times, and Cost as teams grow, Deployment footprint and Multi-cluster reach count once. The five listed first, of eight, each out of 90: Kpow 82, which takes its best score on Access control and audit (10 out of 10) and its lowest on Cost as teams grow (7 out of 10), Licence: Commercial, free Community Edition; Kafbat UI 60, Licence: Apache 2.0, free; AKHQ 57, Licence: Apache 2.0, free; Redpanda Console 55, Licence: Business Source License; Kadeck 53, Licence: Commercial.
What does a Kafka UI actually do?
Most Kafka UIs converge on the same set of functional categories. The depth of coverage varies, but the categories are stable.
Topic management. Create, delete, and reconfigure topics, inspect partition layout and replica placement, and read messages from a partition with offset, key, header, and value filtering. How far that filtering reaches, from a single partition to many topics at once, varies a lot between tools, as the comparison of Kafka message search tools shows. Topic management is the day-to-day surface for both operators and developers, covering everything from partition count decisions to per-topic retention and compaction settings.
Consumer group monitoring and offset management. View consumer group membership, per-partition lag, current offset against log-end offset, and reset or seek consumer offsets when a consumer needs to replay or skip a window of data.
Broker and cluster health. Broker liveness, controller identity, partition distribution, under-replicated and offline partitions, and basic throughput metrics at the broker level.
Schema registry integration. Browse subjects, view schema versions and compatibility settings, and decode Avro, Protobuf, or JSON Schema payloads in the message viewer so message content is human-readable.
Access control. Surface and manage ACLs or RBAC role assignments depending on the underlying authorisation model, and capture an audit trail of who changed what.
Connector management. List Kafka Connect connectors, view status and task health, pause and restart connectors, and inspect configuration.
Producer tooling. Send test messages with arbitrary keys, headers, and serialisers from inside the UI, exercising the same producer path that application code uses.
Each of these categories maps to a different operational job, and a tool’s coverage of any one of them is rarely binary. Most UIs do the easy parts well and differ on the harder parts: schema-aware filtering, RBAC granularity, Connect task observability, and offset-reset workflows.
The thing that everyone uses it for is just finding data in Kafka. Like, put messages into Kafka, don't know what happened to them.
Derek Troy-West, Co-founder and CEO of Factor House
Kpow live demo
See a production Kafka UI in action
The real question is how a UI helps when many teams share Kafka. Use the Kpow demo to explore the operational surface instead of judging it from screenshots alone.
Designed for platform and data engineers running Kafka in production.
Try the Kpow demoThe Kafka UI landscape
The market splits into three rough categories.
Open-source and self-hosted. Kafbat UI, Redpanda Console, and AKHQ sit here. They are free to download, ship as Docker images or self-contained binaries, and cover the core functional categories well. Governance features such as fine-grained RBAC, audit trails, and data masking are typically thinner or behind a paid tier. A comparison of the most widely-used options is available in best free kafka ui tools.
Commercial and self-hosted or managed. Kpow, Conduktor, Lenses.io, and Kadeck sit here. They charge a per-cluster, per-user, or per-seat fee in exchange for deeper RBAC, audit logging, governance workflows, and vendor support. Deployment is usually still under your control. For a broader view across both open-source and commercial options, best kafka management tools covers the full landscape.
Vendor-bundled. Confluent Control Center is the canonical example. It ships as part of Confluent Platform and integrates tightly with Confluent’s Schema Registry, ksqlDB, Cluster Linking, and MDS-based RBAC. The trade-off is that it is effectively locked to Confluent deployments.
One landscape shift worth flagging: Kafka 4.0 fully removed ZooKeeper in March 2025, and KRaft is now the only supported metadata mode. Any UI that still relies on ZooKeeper-based metadata APIs has a gap to close. The well-maintained tools have already made the transition. If you are evaluating something less actively developed, confirm KRaft support before committing.
How to evaluate a Kafka UI: key criteria
The criteria below are the ones that weigh most heavily in a real evaluation. Different teams will rank them differently, but skipping any of them tends to produce regret a year in.
Monitoring and observability depth
The baseline question is whether the UI surfaces the metrics that actually move during an incident: consumer lag at partition granularity, under-replicated partitions, offline partitions, broker request latency, and partition skew across brokers. The easy metrics (broker count, topic count, total messages) are uniform across tools. The harder ones are not.
Datadog provides a useful illustration of why visibility matters. The team reduced a host-subscriptions topic from 500,000 messages per second to 5,000 messages per second, a 100x reduction, after gaining clearer visibility into their pipeline. The optimisation freed over 600 CPU cores and 1 TB of memory. The lesson is that observability is what makes optimisation possible: you cannot improve what you cannot see.
A Kafka UI handles the real-time slice of this: point-in-time consumer monitoring, cluster health, and producer visibility. For time-series storage, alerting, and capacity planning, the UI should complement a proper monitoring stack rather than replace it. The kafka monitoring guide covers that boundary in full, including guidance on kafka dashboards, best kafka monitoring tools, and integrations with tools like Grafana.
Access control and multi-tenancy
When a shared cluster supports more than two teams, ACLs alone become difficult to manage. Granular RBAC, audit logging, and an identity-provider integration (SAML, OIDC, LDAP) are the features that matter. Look for role-based authorisation at the topic, consumer-group, and connector level, with the ability to scope roles to a single environment. For multi-tenant Kafka deployments, the UI is where access policies become visible and auditable across teams.
Uber illustrates the scaling problem well. Their custom KafkaAuthorizer uses a single attribute-based policy to replace what would otherwise be thousands of individual ACL entries. A UI that surfaces and manages permissions weakly would make that model unworkable in operation, even if the authentication, authorisation, and encryption at the broker level are sound.
For a deeper treatment of the security model underneath the UI, see the kafka security architecture article.
Product demo · 2 min
Apache Kafka RBAC & multi-tenancy: Kpow demo
Chad Harris walks through tenancy and role-based access control in Kpow: scoping a virtual cluster view down to a single team's topics and metrics, governed by SSO and fine-grained RBAC.
Schema registry support
Schema-aware message viewing is the difference between a useful inspection workflow and a Base64-decoded mess. The UI should resolve subjects automatically, decode Avro, Protobuf, and JSON Schema payloads, surface compatibility rules, and let you view historical schema versions. Schema evolution visibility is particularly useful during incidents involving consumer deserialisation failures. For a tool-by-tool view of subject browsing, version diffs and compatibility checks, see the best tools for Kafka schema registry management.
Product demo · 1 min
Apache Kafka schema registry management: Kpow demo
Chad Harris walks through schema registry management in Kpow, which connects to Confluent, Karapace, MSK, and other registries: viewing and editing schemas, creating new revisions, updating compatibility settings, and creating or deleting subjects.
Kafka Connect management
For teams using Kafka Connect for CDC, sink-to-warehouse, or system integration, the UI should surface connector lifecycle (paused, running, failed), per-task status, and configuration. Restart and pause controls from the UI shorten the loop during connector incidents. Use cases range from ServiceNow integrations to Jira event pipelines, and in each case connector observability is what separates a quick diagnosis from a long one.
Notion replaced custom connectors with Confluent’s pre-built Connect integrations after concluding that the old approach was, in their words, “too expensive and difficult to maintain at scale.” The change saved over $1 million in 2022 and tripled engineering productivity. A UI that surfaces connector health directly reduces the operational cost of running Connect at scale.
Product demo · 2 min
Kafka Connect monitoring and tasks: Kpow demo
Chad Harris walks through Kafka Connect in Kpow: connector and task state at a glance, historical health charts, deploying connectors from the UI, and bulk-restarting a subset of tasks.
Stream processing and ksqlDB visibility
Kafka Streams applications and ksqlDB queries are first-class citizens in many production deployments, but few UIs treat them as such. The ones that do let you inspect topology, internal state stores, and per-query status. If you run Streams applications in production, the ability to navigate from a consumer group back to the topology that owns it, and forward to the state-store partitions that back it, removes a category of debugging that would otherwise need bespoke tooling. For ksqlDB users, the equivalent is a UI that lists queries, their source and sink topics, and their current status.
Deployment model and operational overhead
Self-hosted versus SaaS, single container versus Helm chart, and how the UI authenticates to the cluster (direct broker access, a JMX scrape, or an agent proxy). Security teams will care about the data-plane access model: a UI that proxies all client traffic to brokers has a very different blast radius from one that only reads metadata.
Installation footprint matters during evaluation. Most open-source tools ship a single container that can be running against a test cluster within minutes. Commercial tools tend to involve a Helm chart, an admin database, and an initial RBAC bootstrap, which is closer to an hour of work. SaaS options remove the deployment step entirely but introduce data-residency and connectivity questions.
Multi-cluster and multi-environment management
Almost every team running Kafka in production runs at least three clusters: development, staging, and production. Larger topologies add regional clusters, isolation clusters for regulated workloads, and dedicated clusters for high-throughput pipelines. A UI that handles only one cluster at a time forces operators to tab between browser windows, breaks audit trails at cluster boundaries, and makes cross-environment comparison (does the staging topic config actually match production?) tedious.
When evaluating multi-cluster support, look for: a cluster switcher that preserves context, unified search across clusters, environment-aware RBAC so that production write permissions do not leak to development users, and a way to compare topic configuration across clusters without leaving the UI. Some tools also offer global catalogs that list every topic across every cluster in one view, which is useful in topologies where the same logical topic name is used across environments.
Producer and consumer tooling
The ability to produce a test message and consume from an arbitrary offset is a small feature with large operational impact. During incidents, the question “is the producer actually sending, and is the broker actually accepting?” comes up often. A UI that lets you produce a known-good message from a known-good identity narrows the search space quickly. Related tools for managing offsets and records from the CLI include the kafka offset tool, the ability to delete records from a topic, and the kafka admin tool.
Pricing model and total cost of ownership
Free is not the same as low cost. Open-source tools have no licence fee, but the engineering time spent deploying them, upgrading them when the upstream project releases a new version, patching them when a CVE lands, and carrying them on the on-call rotation is real. For a small team running a single cluster, that overhead is trivial. For a platform team running ten clusters across three regions, it adds up.
Commercial tools split into two pricing shapes. Per-cluster pricing (often used for self-hosted commercial tools) scales with infrastructure and is predictable as headcount changes. Per-seat or per-user pricing scales with adoption: the more useful the tool is, the more it costs. For topologies where the goal is broad self-service, per-cluster pricing tends to age better. For topologies where access is restricted to a small platform team, per-seat pricing can be cheaper.
A complete TCO model should include: licence fees, the engineering cost of deployment and maintenance (often half a person, sometimes more), support tier costs, and the opportunity cost of operator time spent in CLI workflows that the UI would have automated. The last item is hardest to quantify but often the largest.
Performance and footprint at scale
How does the UI itself behave when it is pointed at a cluster with thousands of topics and hundreds of consumer groups? Page load times, search responsiveness, message-viewer latency, and the memory footprint of the UI server become operational concerns at the kind of scale referenced in the JPMorgan and Walmart case studies. Some UIs paginate well and use server-side filtering; others pull metadata in bulk and degrade noticeably past a few thousand topics. If your topology is at that scale, ask vendors for a benchmark against a comparable topic count, and if you are evaluating an open-source tool, test it against a representative cluster before committing.
Disaster recovery and cluster linking visibility
For multi-region deployments, the UI’s view into replication health matters. MirrorMaker 2 topology, replication lag between source and target clusters, and the configuration of replicated topics are all things you want to inspect from one place rather than from a mix of CLI and broker logs. Confluent Cluster Linking introduces a different model that some UIs surface natively and others ignore. Barclays runs Confluent Kafka on Amazon EKS with multi-region active-active and active-passive configurations, and Walmart operates Kafka across public and private clouds. At that footprint, replication visibility is a security and compliance concern as much as an operational one.
Kafka UI and security
Security is non-negotiable when a UI has read and write access to a production cluster. The kafka security architecture has several layers, and the UI touches most of them. The relevant dimensions are:
Authentication. SSO via SAML or OIDC, LDAP integration for on-prem identity providers, and local users as a fallback. Avoid tools that only support local users in production deployments.
Authorisation granularity. Cluster-level, topic-level, consumer-group-level, and connector-level role assignments. The right granularity depends on how many teams share the cluster: a single-team deployment can live with cluster-level roles, a multi-team deployment cannot.
Audit logging. Every write action (offset reset, topic creation or deletion, connector restart, ACL change) should produce a tamper-evident audit record. For regulated industries, the audit log needs to be exportable to a SIEM.
Network exposure. A UI server with broker credentials is a sensitive surface. Bind it to an internal network, put it behind your existing identity proxy, and avoid exposing it to the public internet even with authentication enabled.
Data-plane access model. Some UIs proxy all client traffic to brokers, which means the UI host needs to be sized for the throughput it serves. Others only read metadata and produce or consume on demand, which keeps the UI host small but moves the data path back to the client. Both are valid; the right choice depends on your network model.
Barclays is a useful reference here: Confluent Kafka on Amazon EKS, multi-region active-active and active-passive, Kafka-centric systems owned by a central platform team under SRE principles. At that scale and in a regulated industry, an unsecured kafka security surface is a material risk, and the platform team’s choice of UI is part of the compliance story.
Kafka UI and monitoring: where the overlap ends
Most Kafka UIs ship some level of built-in metrics. They are not substitutes for a proper monitoring stack. The boundary between the two is worth being explicit about.
A Kafka UI is for real-time operational interaction: point-in-time inspection, debugging, ad-hoc reads of message content, manual offset management, and connector control. Its job is to answer “what is happening right now, and what action do I want to take?”
A monitoring stack (Prometheus and Grafana, Datadog, New Relic, Dynatrace) is for time-series storage, alerting on thresholds, SLO tracking, anomaly detection, and historical analysis. Its job is to answer “what has happened over the last hour, day, or quarter, and should someone be paged?”
A useful checklist when evaluating where to draw the line:
- UI responsibilities: consumer-group lag at the moment of inspection, partition state, broker liveness, message content inspection, schema lookup, ad-hoc producer test, connector status and restart.
- Monitoring stack responsibilities: lag trended over time, alerting when lag breaches a threshold, broker JVM metrics, request-latency percentiles, retention and tiered-storage usage trends, capacity planning.
In practice, both layers consume similar broker JMX metrics. The standard convention is to scrape with kafka-exporter and the JMX exporter, store in Prometheus, and visualise in Grafana. A UI that exposes its own Prometheus scrape endpoint can plug into that pipeline without duplication. Read best practices for kafka data observability for guidance on metric collection patterns and the overlap between tooling layers in depth.
Netflix handles between 700 billion and 2 trillion events per day across its Keystone pipeline and Data Mesh platform. At that volume, a UI alone cannot provide the alerting and anomaly detection that production operations require, and the monitoring stack is what catches the slow-moving regressions a real-time UI is never going to flag. The two layers are complementary, not interchangeable.
Tool-by-tool breakdown
Before the per-tool detail, the comparison table below summarises the dimensions most teams care about during a first-pass evaluation.
| Rank | Tool | Deployment | Licence | RBAC | Multi-cluster | Schema Registry | Connect | Pricing model |
|---|---|---|---|---|---|---|---|---|
| 1 | Kpow | Self-hosted container | Commercial (Community Edition available) | Full (SAML, OIDC, LDAP) | Yes (up to 12 per instance) | Yes | Yes | Per cluster |
| 2 | Kafbat UI | Self-hosted container | Open-source (Apache 2.0) | Per resource (YAML) | Yes | Yes | Yes | Free |
| 3 | AKHQ | Self-hosted Micronaut app | Open-source (Apache 2.0) | Basic | Yes | Yes | Yes | Free |
| 4 | Redpanda Console | Self-hosted Go binary | Open-core (BSL / RCL) | Behind enterprise licence | One broker cluster per deployment | Yes | Yes | Free + enterprise |
| 5 | Kadeck | Desktop and server | Commercial | Enterprise (LDAP, OIDC) | Yes (Server tier) | Yes | Yes | Per user |
| 6 | Lenses.io | Kubernetes-required | Commercial | Full | Yes | Yes | Yes | Per tier, with a user cap |
| 7 | Confluent Control Center | Bundled with Confluent Platform | Commercial (Confluent Enterprise) | Full (MDS-based) | Yes | Yes | Yes | Bundled |
| 8 | Conduktor | Self-hosted web platform | Commercial (open-core Community tier) | Full | Yes | Yes | Yes | Per seat |
 Rank 1
 Kpow
82 out of 90 Total
Try Kpow in the live demo No signup needed.
- Licence
- Commercial, free Community Edition
- Price
- From $4,500 per cluster, 100 users
- Clusters
- Up to 12 per instance
- Cost as teams grow
- 7 out of 10
- Deployment footprint
- 9 out of 10
- Support and maintenance ×3 weight, this criterion counts 3 times toward the total
- 9 out of 10
- Access control and audit ×3 weight, this criterion counts 3 times toward the total
- 10 out of 10
- Multi-cluster reach
- 9 out of 10
Why these scores for Kpow
- Cost as teams grow 7 out of 10
- Priced per cluster, it ‘keeps cost predictable as headcount changes’, and the Kpow pricing page puts Enterprise from $4,500 per cluster with 100 users. Community Edition is free for 3 clusters and 10 users but holds back RBAC, masking and audit, so it sits below the free open-source tools.
- Deployment footprint 9 out of 10
- A ‘Stateless JVM container that runs against any Apache Kafka cluster’ needs no database, sidecar or volume. Kafdrop is the lighter tool elsewhere on the site.
- Support and maintenance 9 out of 10
- Commercial and self-hosted, it carries an Enterprise support SLA on the Kpow features page and is shipping continuously.
- Access control and audit 10 out of 10
- It offers ‘deep RBAC backed by SAML, OIDC, LDAP, or Keycloak SSO’ and this page’s table rates RBAC ‘Full’, while the Kpow vs Kafdrop comparison adds server-side masking and an in-product audit log, all on Enterprise, which ties Conduktor.
- Multi-cluster reach 9 out of 10
- It runs ‘Up to 12 clusters per instance’ against any Apache Kafka cluster, and the 12-cluster cap keeps it level with the uncapped Kafbat UI, AKHQ and Conduktor, not above.
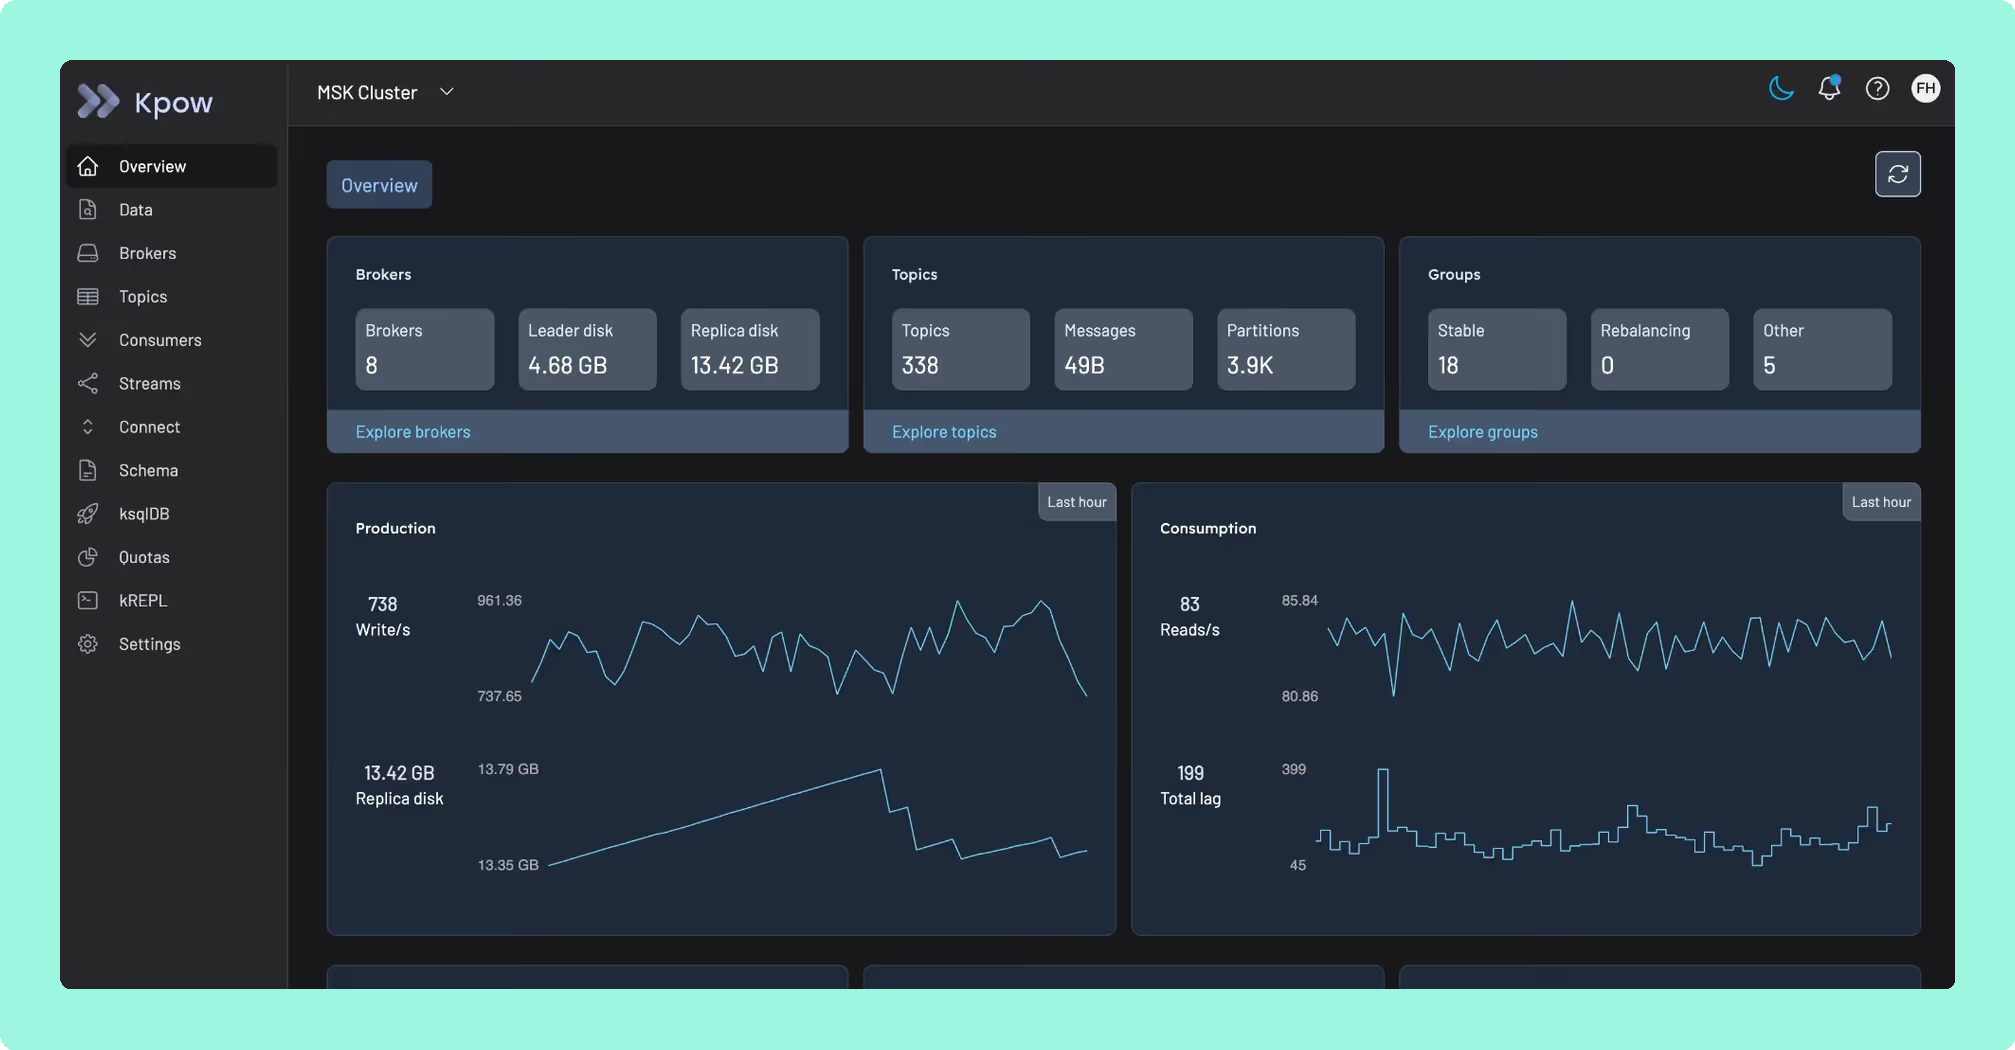
Commercial, self-hosted. Stateless JVM container that runs against any Apache Kafka cluster, with deep RBAC backed by SAML, OIDC, LDAP, or Keycloak SSO, full support for Schema Registry, Kafka Connect, ksqlDB, ACL management, and Kafka Streams topology visualisation. Up to 12 clusters per instance. Designed for SRE and platform teams running multi-cluster Kafka in regulated environments. Pricing is per cluster, which keeps cost predictable as headcount changes.
Staying patched. Kpow’s release notes name the CVEs each release remediates, and the 96.4 image built on 5 August 2026 bundles 311 dependencies. What a licence buys here is not a different deployment model, because Kpow is self-hosted too. It is a company contracted to ship the fix. Every dependency figure on this page was read on 24 September 2026 from the published artefacts and from nvd.nist.gov.
Compare Kpow vs AKHQKpow vs Kafbat UIKpow vs Redpanda ConsoleKpow vs KadeckKpow vs Lenses.ioKpow vs Confluent Control Center
 Rank 2
 Kafbat UI
60 out of 90 Total
- Licence
- Apache 2.0, free
- Price
- No seat or cluster cap
- Latest release
- v1.5.0, April 2026
- Cost as teams grow
- 10 out of 10
- Deployment footprint
- 8 out of 10
- Support and maintenance ×3 weight, this criterion counts 3 times toward the total
- 5 out of 10
- Access control and audit ×3 weight, this criterion counts 3 times toward the total
- 6 out of 10
- Multi-cluster reach
- 9 out of 10
Why these scores for Kafbat UI
- Cost as teams grow 10 out of 10
- Open-source under Apache 2.0, it is priced ‘Free’ in this page’s table, with no seat or cluster cap and nothing held back.
- Deployment footprint 8 out of 10
- It runs ‘self-hosted as a container’, stateless with a published Helm chart, and takes a mounted volume if the configuration wizard is used, which puts it one below Kpow.
- Support and maintenance 5 out of 10
- It has ‘an active maintainer community’ behind it, and the AKHQ vs Kafbat UI comparison has v1.5.0 in April 2026, commits in August 2026; support is GitHub issues or unpriced professional services with no SLA in the Kpow vs Kafbat UI comparison.
- Access control and audit 6 out of 10
- Roles are configured per resource type in YAML, with six identity provider types and server-side REMOVE, REPLACE and MASK policies, corrected on this page, but there is no per-role masking and no in-product audit view, so it sits below Conduktor and Kpow.
- Multi-cluster reach 9 out of 10
- It supports multi-cluster, marked ‘Yes’ in this page’s table, and another cluster is another config entry with no cap.
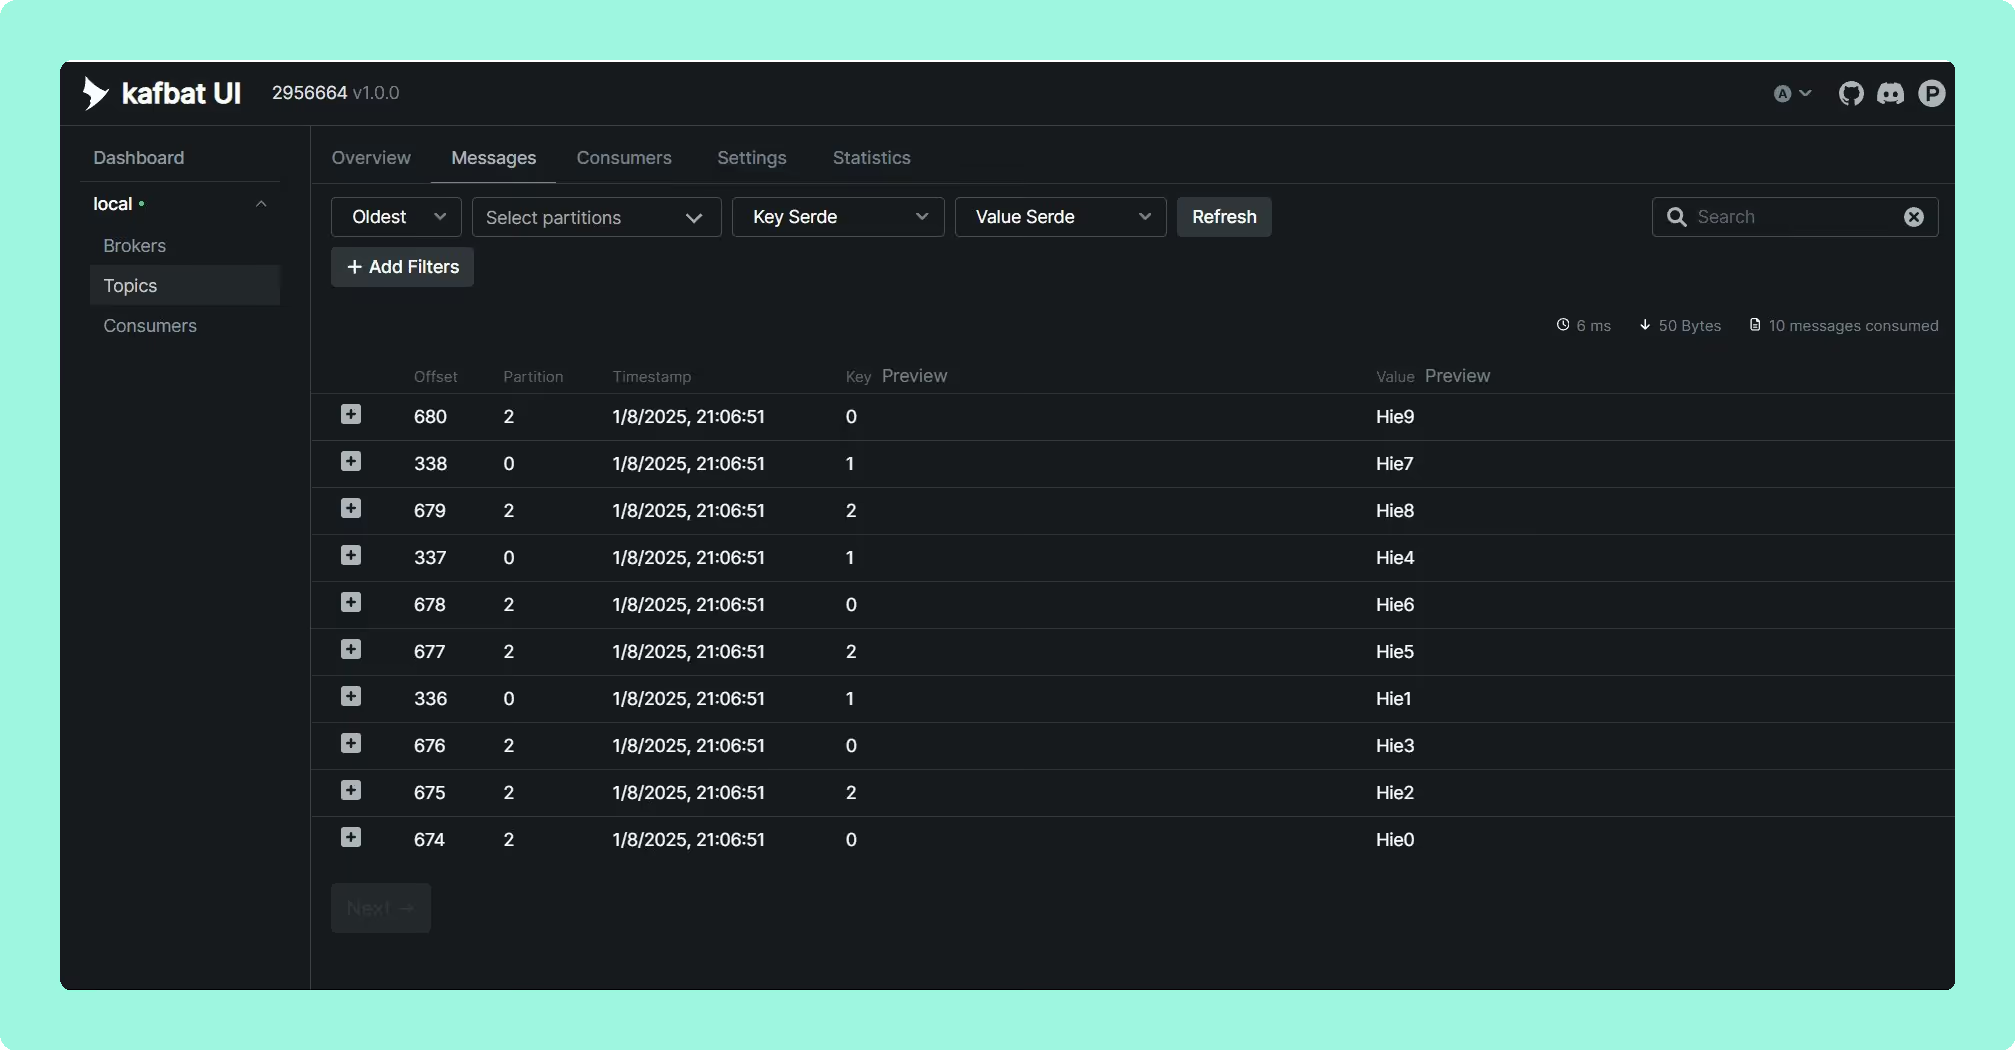
Open-source under Apache 2.0, self-hosted as a container. Wide adoption, an active maintainer community, and good general-purpose coverage including multi-cluster support, Avro, Protobuf, and JSON deserialisation, Schema Registry integration, and CEL-based filtering. Access control is configured in YAML, with roles assigned per resource type and six identity provider types supported, and data masking runs server-side with REMOVE, REPLACE and MASK policies per cluster. What it does not do is vary masking by role or give you an audit view inside the product, so a regulated team still has to read its audit topic somewhere else. Best fit for small to mid-size teams with modest governance needs. Worth noting that Kafbat UI is the active fork of what used to be the “kafka-ui” project on GitHub, which is the source of the recurring naming confusion in the community.
Staying patched. Kafbat UI released v1.5.0 in April 2026 and has not shipped since. In the 157 days since, at least 20 high or critical advisories have been published against libraries that release bundles, including the netty critical CVE-2026-75595. Only 150 of its 266 bundled jars resolved to a Maven coordinate, so that count is a floor and the state of the release itself is unmeasured. Kafbat does publish a security policy, which AKHQ and Kafdrop do not, and the one CVE filed against its own code, CVE-2025-49127, was already fixed in the release that preceded the advisory. Six releases in two years.
Compare Kpow vs Kafbat UIAKHQ vs Kafbat UIKadeck vs Kafbat UIKafbat UI review
 Rank 3
 AKHQ
57 out of 90 Total
- Licence
- Apache 2.0, free
- Price
- No paid tier
- Access control
- Basic RBAC since 0.25
- Cost as teams grow
- 10 out of 10
- Deployment footprint
- 8 out of 10
- Support and maintenance ×3 weight, this criterion counts 3 times toward the total
- 5 out of 10
- Access control and audit ×3 weight, this criterion counts 3 times toward the total
- 5 out of 10
- Multi-cluster reach
- 9 out of 10
Why these scores for AKHQ
- Cost as teams grow 10 out of 10
- It is open-source under Apache 2.0, priced ‘Free’ in this page’s table, the whole product free with no paid tier, and adding an engineer changes nothing.
- Deployment footprint 8 out of 10
- It is ‘deployed as a Micronaut application’ in one JVM container with no database or sidecar, docked one because ‘UI performance is known to degrade on very large clusters’.
- Support and maintenance 5 out of 10
- Open source with no vendor named, it has GitHub issues and the community, no SLA, and three releases in eight months.
- Access control and audit 5 out of 10
- It has OIDC, OAuth2, LDAP and GitHub SSO with basic RBAC since 0.25; masking, corrected on this page, is one YAML filter per topic, the same for every user, and audit is an opt-in Kafka topic with no view.
- Multi-cluster reach 9 out of 10
- This page’s table marks multi-cluster ‘Yes’, and one deployment reaches one cluster or many.
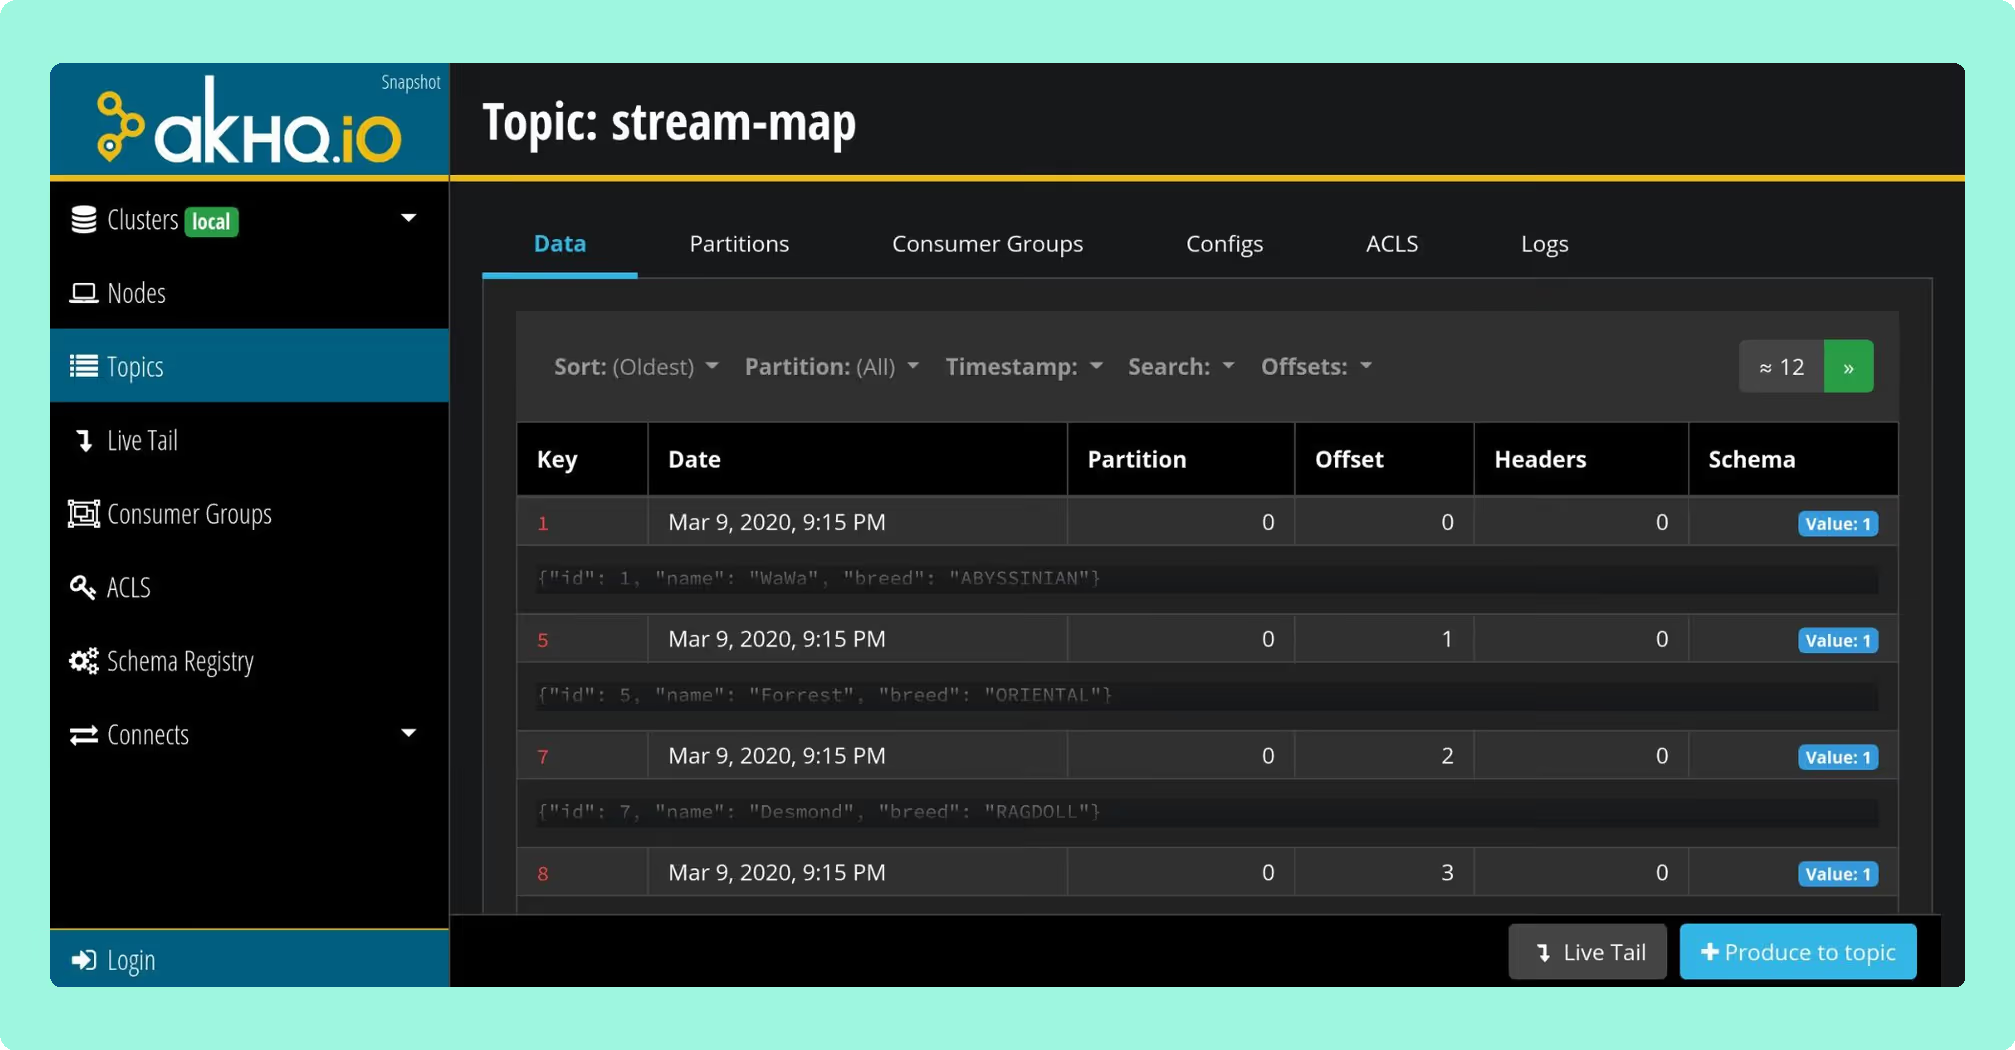
Open-source under Apache 2.0, deployed as a Micronaut application. GitOps-friendly configuration, OIDC, OAuth2, LDAP, and GitHub SSO, full Connect and Schema Registry coverage, and ksqlDB support. Basic RBAC since version 0.25. Data masking is a regex or JSON filter in the application YAML, one filter per topic and the same for every user, and audit events are opt-in, written to a Kafka topic the operator nominates with no audit view in the product. UI performance is known to degrade on very large clusters. Best fit for teams wanting a free, GitOps-native tool whose masking does not need to vary by role.
Staying patched. AKHQ has no CVE filed against its own code, and that is the wrong number to plan against. Release 0.28.0, cut on 6 August 2026, bundles 270 libraries and 18 of them carry a high or critical advisory. Sixteen were already public, with fixed versions already on Maven Central, on the day it shipped, and five are netty advisories Kpow had remediated three weeks earlier in 96.2: CVE-2026-44249, CVE-2026-45416, CVE-2026-45674, CVE-2026-47691 and CVE-2026-50010. The oldest has been open 108 days. That is exposure and remediation latency rather than a working attack, and every figure resolves against the published jar and nvd.nist.gov. Four releases in two years, and no security policy at any path GitHub reads.
Compare Kpow vs AKHQAKHQ vs Kafbat UIAKHQ vs Redpanda ConsoleAKHQ review
 Rank 4
 Redpanda Console
redpanda.com
55 out of 90 Total
- Licence
- Business Source License
- Price
- Enterprise licence, no public price
- Clusters
- One broker cluster per deployment
- Cost as teams grow
- 6 out of 10
- Deployment footprint
- 8 out of 10
- Support and maintenance ×3 weight, this criterion counts 3 times toward the total
- 7 out of 10
- Access control and audit ×3 weight, this criterion counts 3 times toward the total
- 6 out of 10
- Multi-cluster reach
- 2 out of 10
Why these scores for Redpanda Console
- Cost as teams grow 6 out of 10
- Its community edition is BSL-licensed and listed as ‘Free + enterprise’, while SSO, RBAC and masking need a Redpanda Enterprise licence with no published price.
- Deployment footprint 8 out of 10
- Self-hosted as a Go binary, it ships as a container or Helm chart holding no state, plus an external Schema Registry.
- Support and maintenance 7 out of 10
- Open-core with an enterprise contract, it reached v3.11.0 on 25 August 2026 in the Kafbat UI vs Redpanda Console comparison, and gives a vendor contract where licensed or a public tracker otherwise (AKHQ vs Redpanda Console).
- Access control and audit 6 out of 10
- The page’s summary has ‘SSO, RBAC, and data masking sit behind the Redpanda enterprise licence’, and audit is a Redpanda platform capability, not a Console one.
- Multi-cluster reach 2 out of 10
- One broker cluster runs per deployment whichever licence you hold, as this page’s corrected record has it, and the Kafdrop vs Redpanda Console comparison has the broker-tier multi-cluster request open since April 2022. Several Connect clusters remain.
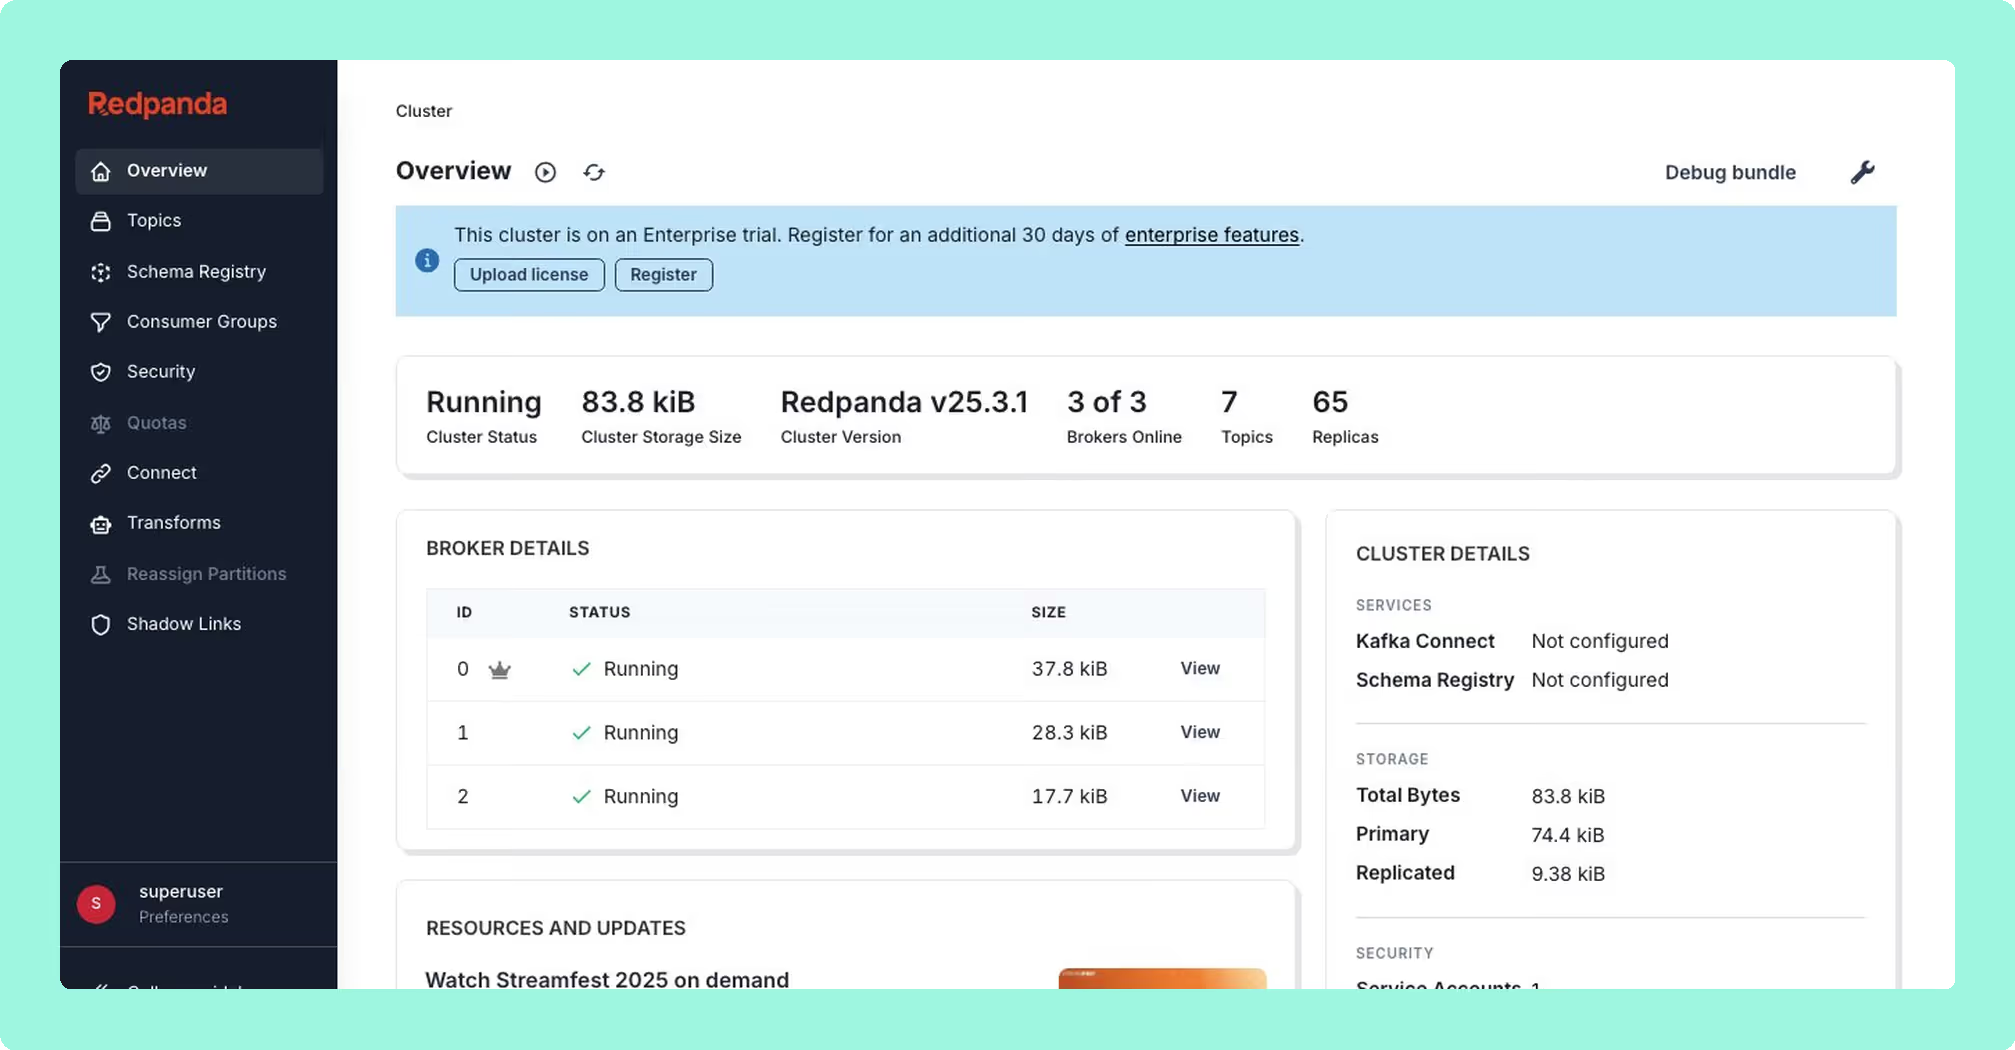
Open-core, Go binary. Fast message viewer and a clean operator experience. The community edition is BSL-licensed and includes Kafka Connect management; SSO, RBAC, and data masking sit behind the Redpanda enterprise licence. Each deployment manages one broker cluster whichever licence you hold, so development, staging, and production mean three Console instances. Best fit for existing Redpanda customers with enterprise contracts. If you run Apache Kafka rather than Redpanda, the value is narrower.
Compare Kpow vs Redpanda ConsoleKafbat UI vs Redpanda ConsoleConduktor vs Redpanda ConsoleRedpanda Console review
 Rank 5
 Kadeck
kadeck.com
53 out of 90 Total
- Licence
- Commercial
- Price
- From $32 per user a month
- Minimum
- 10 users on Enterprise
- Cost as teams grow
- 4 out of 10
- Deployment footprint
- 4 out of 10
- Support and maintenance ×3 weight, this criterion counts 3 times toward the total
- 6 out of 10
- Access control and audit ×3 weight, this criterion counts 3 times toward the total
- 6 out of 10
- Multi-cluster reach
- 9 out of 10
Why these scores for Kadeck
- Cost as teams grow 4 out of 10
- It prices per user with a ten-user minimum on Enterprise, where governance sits, at $32 per user per month or $3,840 a year below ten people in the AKHQ vs Kadeck comparison, and free is 5 users on 1 cluster.
- Deployment footprint 4 out of 10
- Desktop-first with a server tier, its teams edition ships only as a Docker image, with no Helm chart, an external database on the Kubernetes path, and an online licence check at start.
- Support and maintenance 6 out of 10
- It comes from a commercial vendor with vendor support under the licence, and the container does not start without the licence service.
- Access control and audit 6 out of 10
- RBAC with LDAP and OpenID Connect, Data Protection Policies masking and audit logs are all Enterprise, corrected on this page, and no SAML is named.
- Multi-cluster reach 9 out of 10
- This page’s table gives ‘Yes (Server tier)’, with unlimited clusters on both paid tiers and one on free, across Apache Kafka, Redpanda and Kinesis.
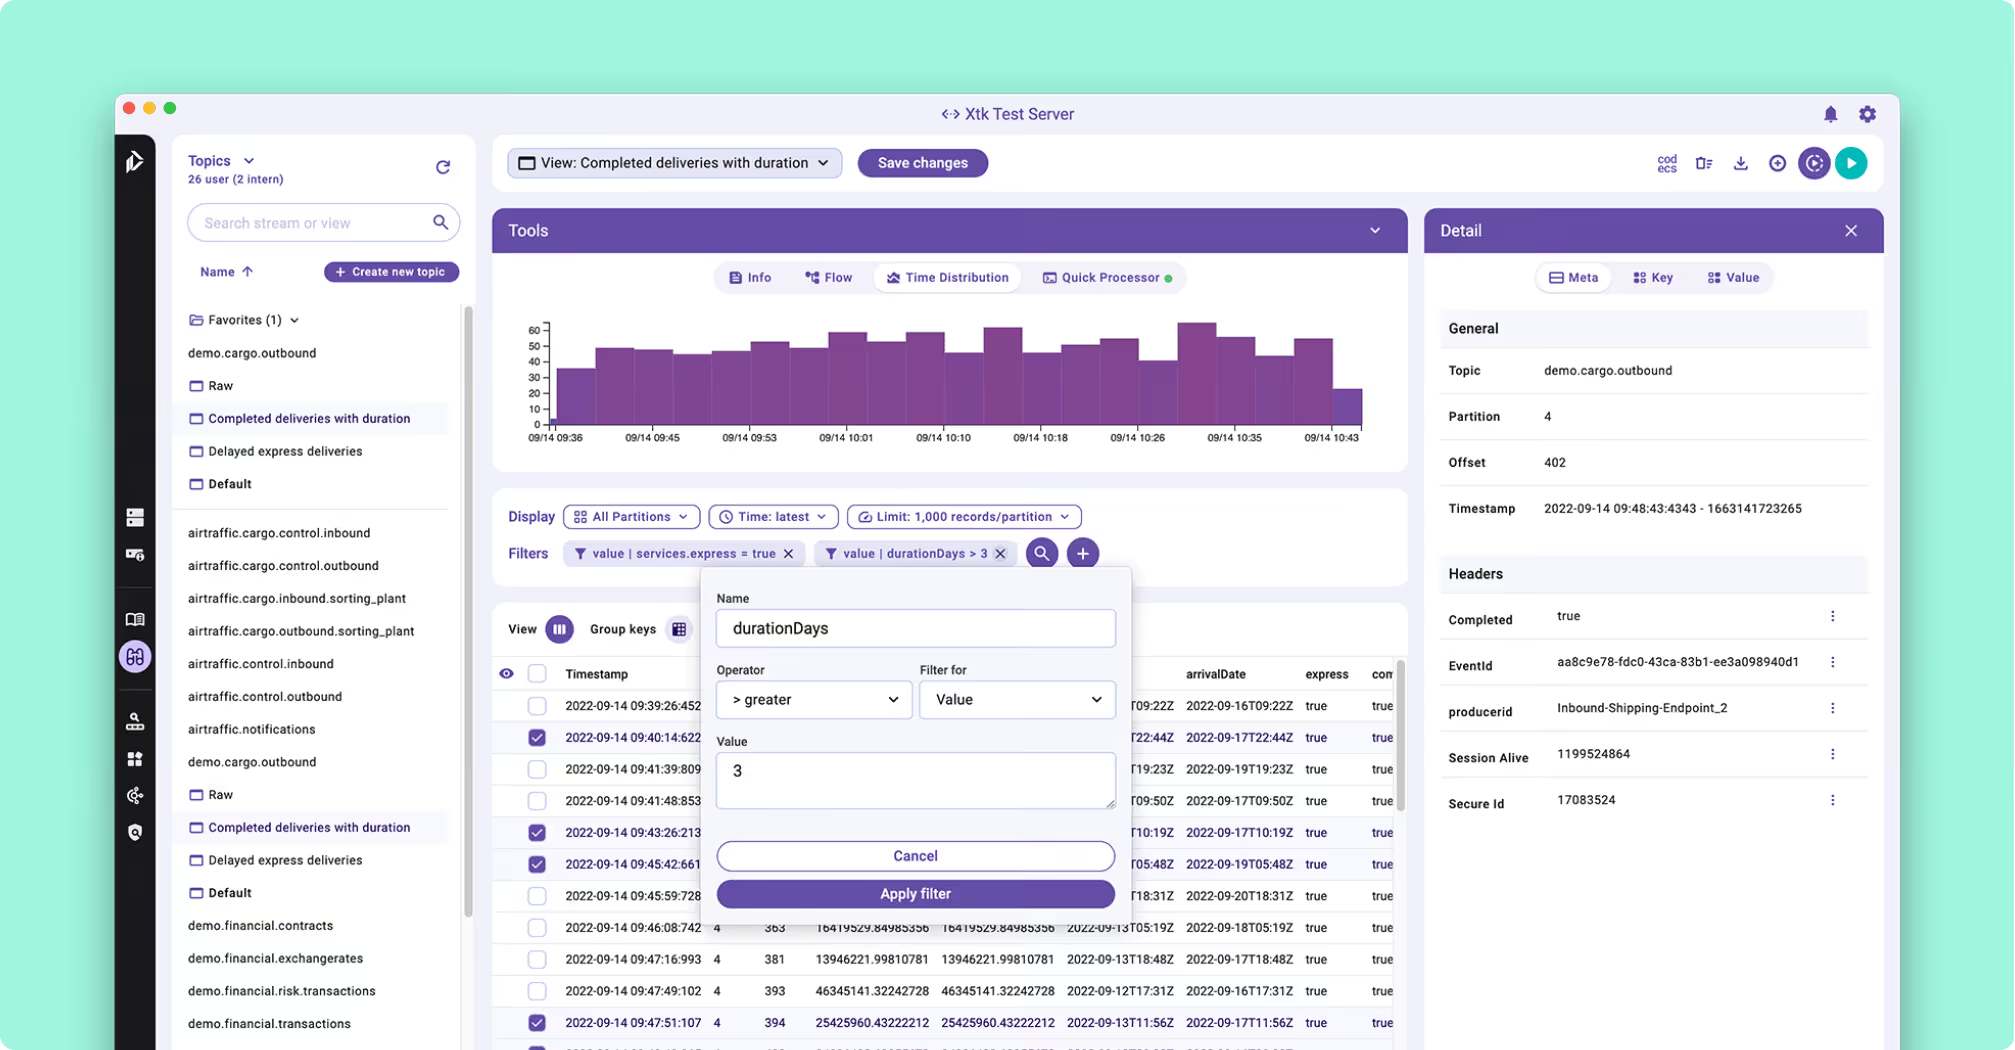
Commercial. Desktop-first product with a server tier for team deployments. Good for individual developer use and quick local inspection of clusters. RBAC with LDAP and OpenID Connect, data masking through Data Protection Policies, and audit logs are all Enterprise features, priced per user with a ten-user minimum, so a team that needs shared audit trails and centralised RBAC buys that tier for every seat.
Compare Kpow vs KadeckKadeck vs Kafbat UIAKHQ vs KadeckKadeck review
 Rank 6
 Lenses.io
lenses.io
52 out of 90 Total
- Licence
- Commercial
- Price
- Team from $4,000 a year
- Users
- 15 on Team, 5 on Community
- Cost as teams grow
- 4 out of 10
- Deployment footprint
- 2 out of 10
- Support and maintenance ×3 weight, this criterion counts 3 times toward the total
- 6 out of 10
- Access control and audit ×3 weight, this criterion counts 3 times toward the total
- 7 out of 10
- Multi-cluster reach
- 7 out of 10
Why these scores for Lenses.io
- Cost as teams grow 4 out of 10
- This page’s table prices it per tier with a user cap, and the Kpow vs Lenses comparison gives Community 5 users with no SSO or RBAC, Team from $4,000 a year for 15 users on one cluster, and custom pricing above that.
- Deployment footprint 2 out of 10
- It is ‘Kubernetes-required (SQL Processors run as Kubernetes pods)’ and ‘The Kubernetes dependency adds operational overhead’, with HQ on PostgreSQL plus an Agent and Agent database per cluster.
- Support and maintenance 6 out of 10
- The page says its ‘post-acquisition product direction is worth confirming with the vendor’, a vendor contract starts at Team, and the Lenses review records that HQ has no HA.
- Access control and audit 7 out of 10
- RBAC is rated ‘Full’ in this page’s table alongside data policies, SSO, SAML and RBAC start from Team, and audit is in-product, but masking is global by field name and does not vary by role.
- Multi-cluster reach 7 out of 10
- It offers ‘a global multi-cluster catalog’ with one Agent per cluster, and federated multi-Kafka comes only at the custom-priced top tier.
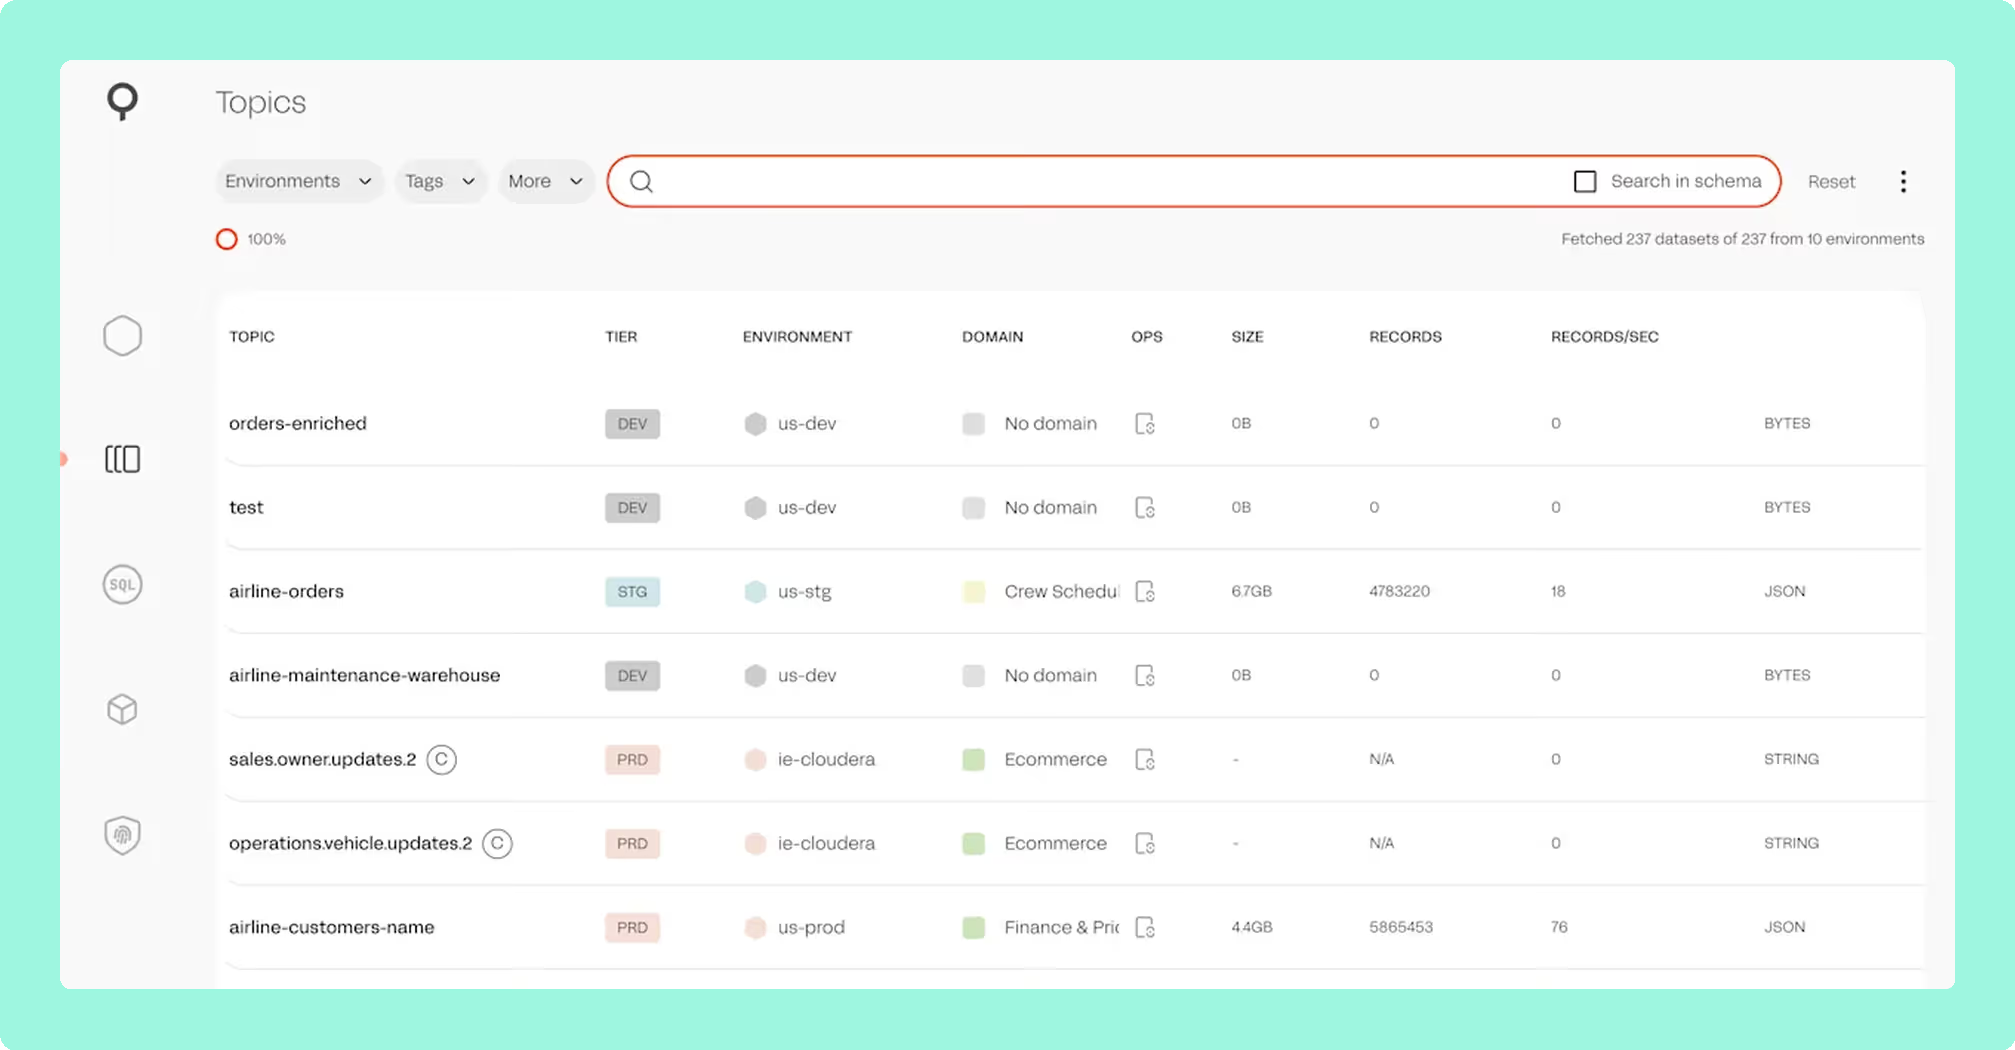
Commercial, Kubernetes-required (SQL Processors run as Kubernetes pods). The differentiator is SQL-driven stream processing alongside observability, including topology visualisation, a Kafka-to-Kafka replicator, a global multi-cluster catalog, and data policies. Best fit for teams wanting SQL-driven stream processing inside the same tool that handles operational interaction. The Kubernetes dependency adds operational overhead, and post-acquisition product direction is worth confirming with the vendor during evaluation.
Compare Kpow vs Lenses.ioConduktor vs LensesKafbat UI vs LensesLenses.io review
Confluent Control Center
confluent.io
46 out of 90 Total
- Licence
- Confluent Platform Enterprise
- Price
- Bundled, roughly $50,000 to $500,000 a year
- Clusters
- Confluent deployments only
- Cost as teams grow
- 2 out of 10
- Deployment footprint
- 2 out of 10
- Support and maintenance ×3 weight, this criterion counts 3 times toward the total
- 6 out of 10
- Access control and audit ×3 weight, this criterion counts 3 times toward the total
- 7 out of 10
- Multi-cluster reach
- 3 out of 10
Why these scores for Confluent Control Center
- Cost as teams grow 2 out of 10
- Bundled with Confluent Platform Enterprise, it lands at ‘roughly $50,000 to $500,000+ per year’, with no published price and no free tier beyond an evaluation.
- Deployment footprint 2 out of 10
- It is ‘Bundled with Confluent Platform’ and needs dedicated nodes at 4 cores, 8 GB and 200 GB up to 100,000 replicas in the Confluent Control Center vs Kafdrop comparison, plus a Metrics Reporter JAR on the brokers.
- Support and maintenance 6 out of 10
- Vendor-bundled under an enterprise contract, it gets quarterly patches for the current version only and no public issue tracker.
- Access control and audit 7 out of 10
- It has ‘MDS-based RBAC’, rated ‘Full (MDS-based)’ in this page’s table, with audit of authentication and authorisation events and no masking described.
- Multi-cluster reach 3 out of 10
- It is ‘Effectively locked to Confluent deployments’, and the reporter JAR cannot go on MSK, Redpanda or Aiven.
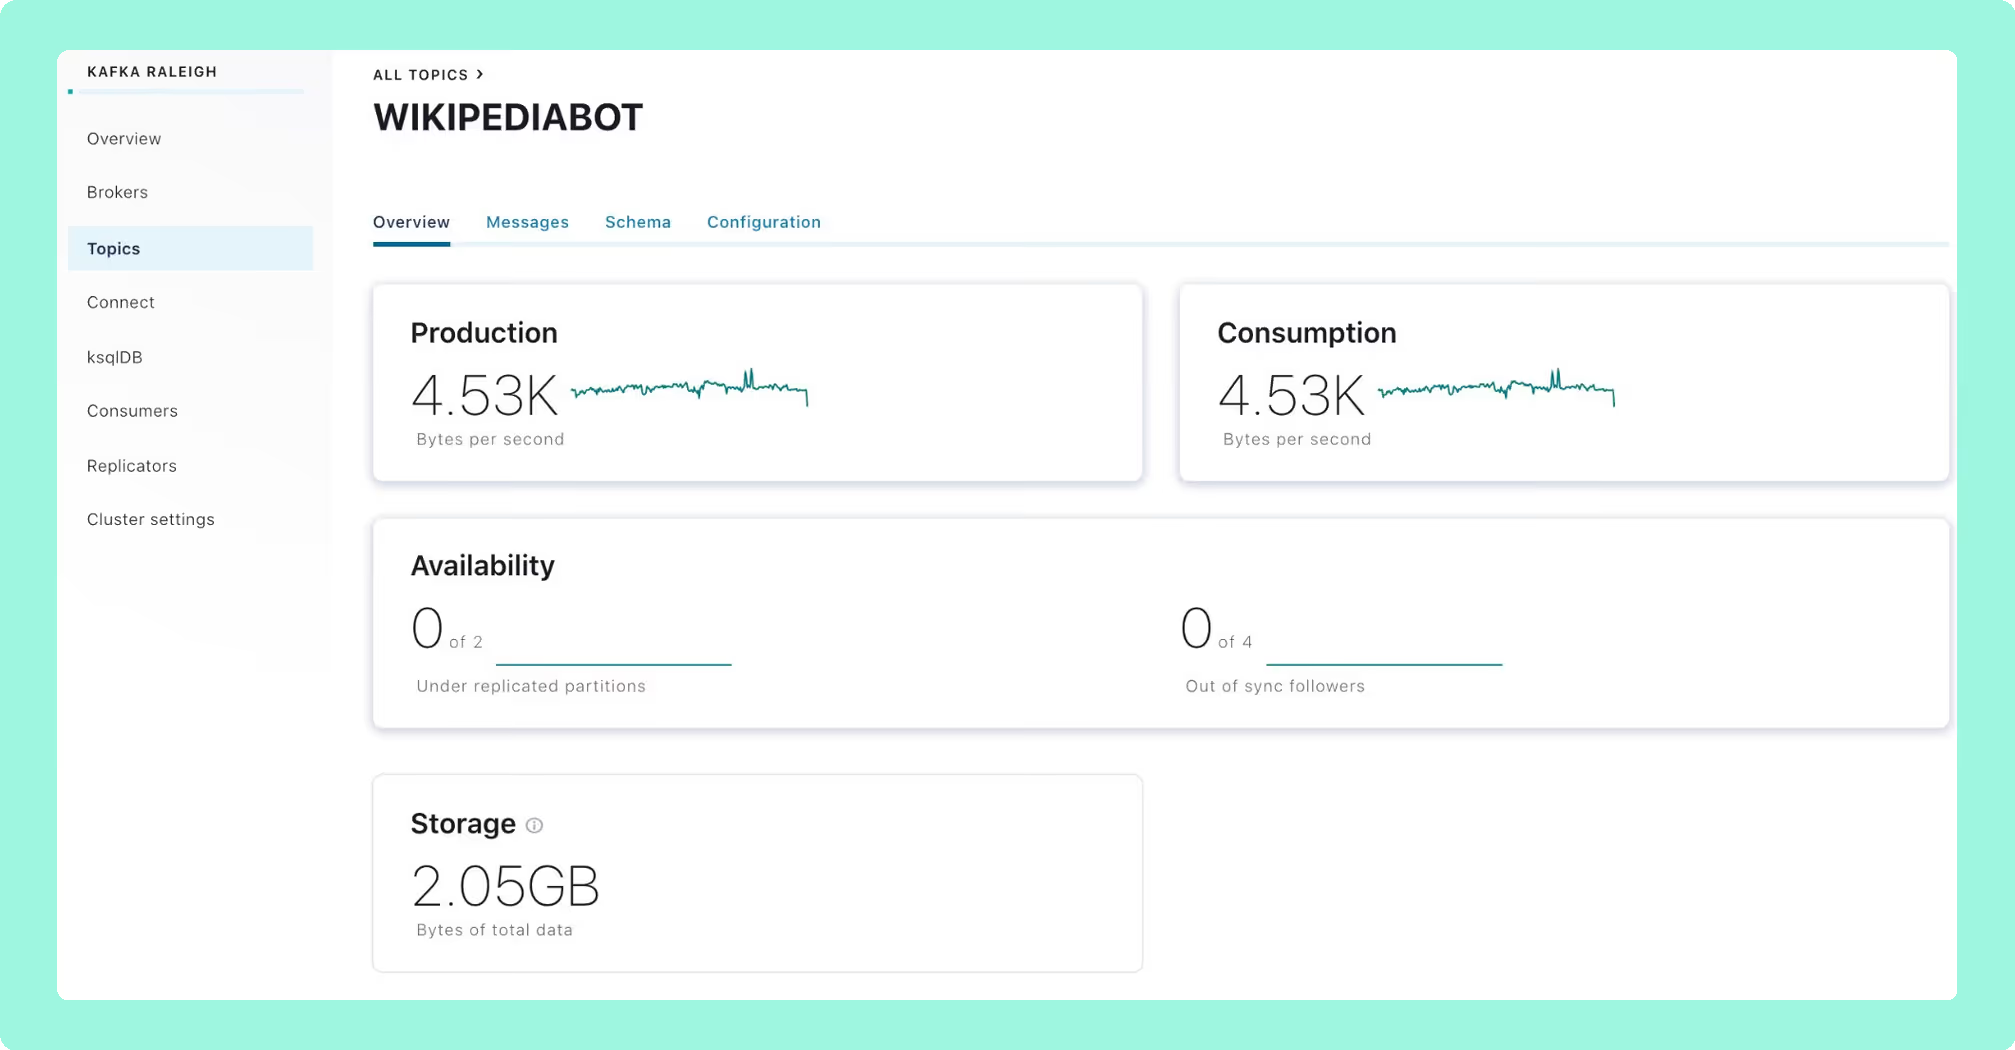
Bundled with Confluent Platform Enterprise. Native integration with the Confluent ecosystem: Schema Registry, ksqlDB, Cluster Linking, and MDS-based RBAC. Effectively locked to Confluent deployments, and the advanced features depend on MDS being present. Typical Confluent Platform pricing ranges from roughly $50,000 to $500,000+ per year, depending on cluster footprint and support tier.
Compare Kpow vs Confluent Control CenterConduktor vs Confluent Control CenterConfluent Control Center vs Kafbat UIConfluent Control Center review
 Rank 8
 Conduktor
conduktor.io
74 out of 90 Total
- Licence
- Commercial, free Community tier
- Price
- $1,200 per seat a year
- Free tier
- 3 clusters, 50 users
- Cost as teams grow
- 5 out of 10
- Deployment footprint
- 3 out of 10
- Support and maintenance ×3 weight, this criterion counts 3 times toward the total
- 9 out of 10
- Access control and audit ×3 weight, this criterion counts 3 times toward the total
- 10 out of 10
- Multi-cluster reach
- 9 out of 10
Why these scores for Conduktor
- Cost as teams grow 5 out of 10
- The page’s own prose has ‘Per-seat pricing scales with adoption’, with 100 users across 3 clusters estimated at $80,000 to $150,000 a year, $1,200 per seat per year in the Conduktor vs Lenses comparison, and a free Community tier for 50 users and 3 clusters in the CMAK vs Conduktor comparison.
- Deployment footprint 3 out of 10
- A self-hosted web platform with an optional Gateway proxy that ‘can introduce risk due to being in the data path’, it requires PostgreSQL 13+ and sized Console and Gateway nodes, as the Conduktor vs Kafdrop comparison records.
- Support and maintenance 9 out of 10
- A commercial vendor backs it under contract, with SOC2 Type II in the Conduktor vs Kafdrop comparison, and it is shipping continuously in the CMAK vs Conduktor comparison.
- Access control and audit 10 out of 10
- This page’s table rates RBAC ‘Full’ with ownership tracking and self-service workflows, the best Kafka management tools page calls it ‘the most complete governance layer in the market’, and the Conduktor vs Kafbat UI comparison records an audit of 70+ event types, which ties Kpow.
- Multi-cluster reach 9 out of 10
- Marked ‘Yes’ in this page’s table, it reaches several clusters from one Console on any distribution, unlimited on Team.
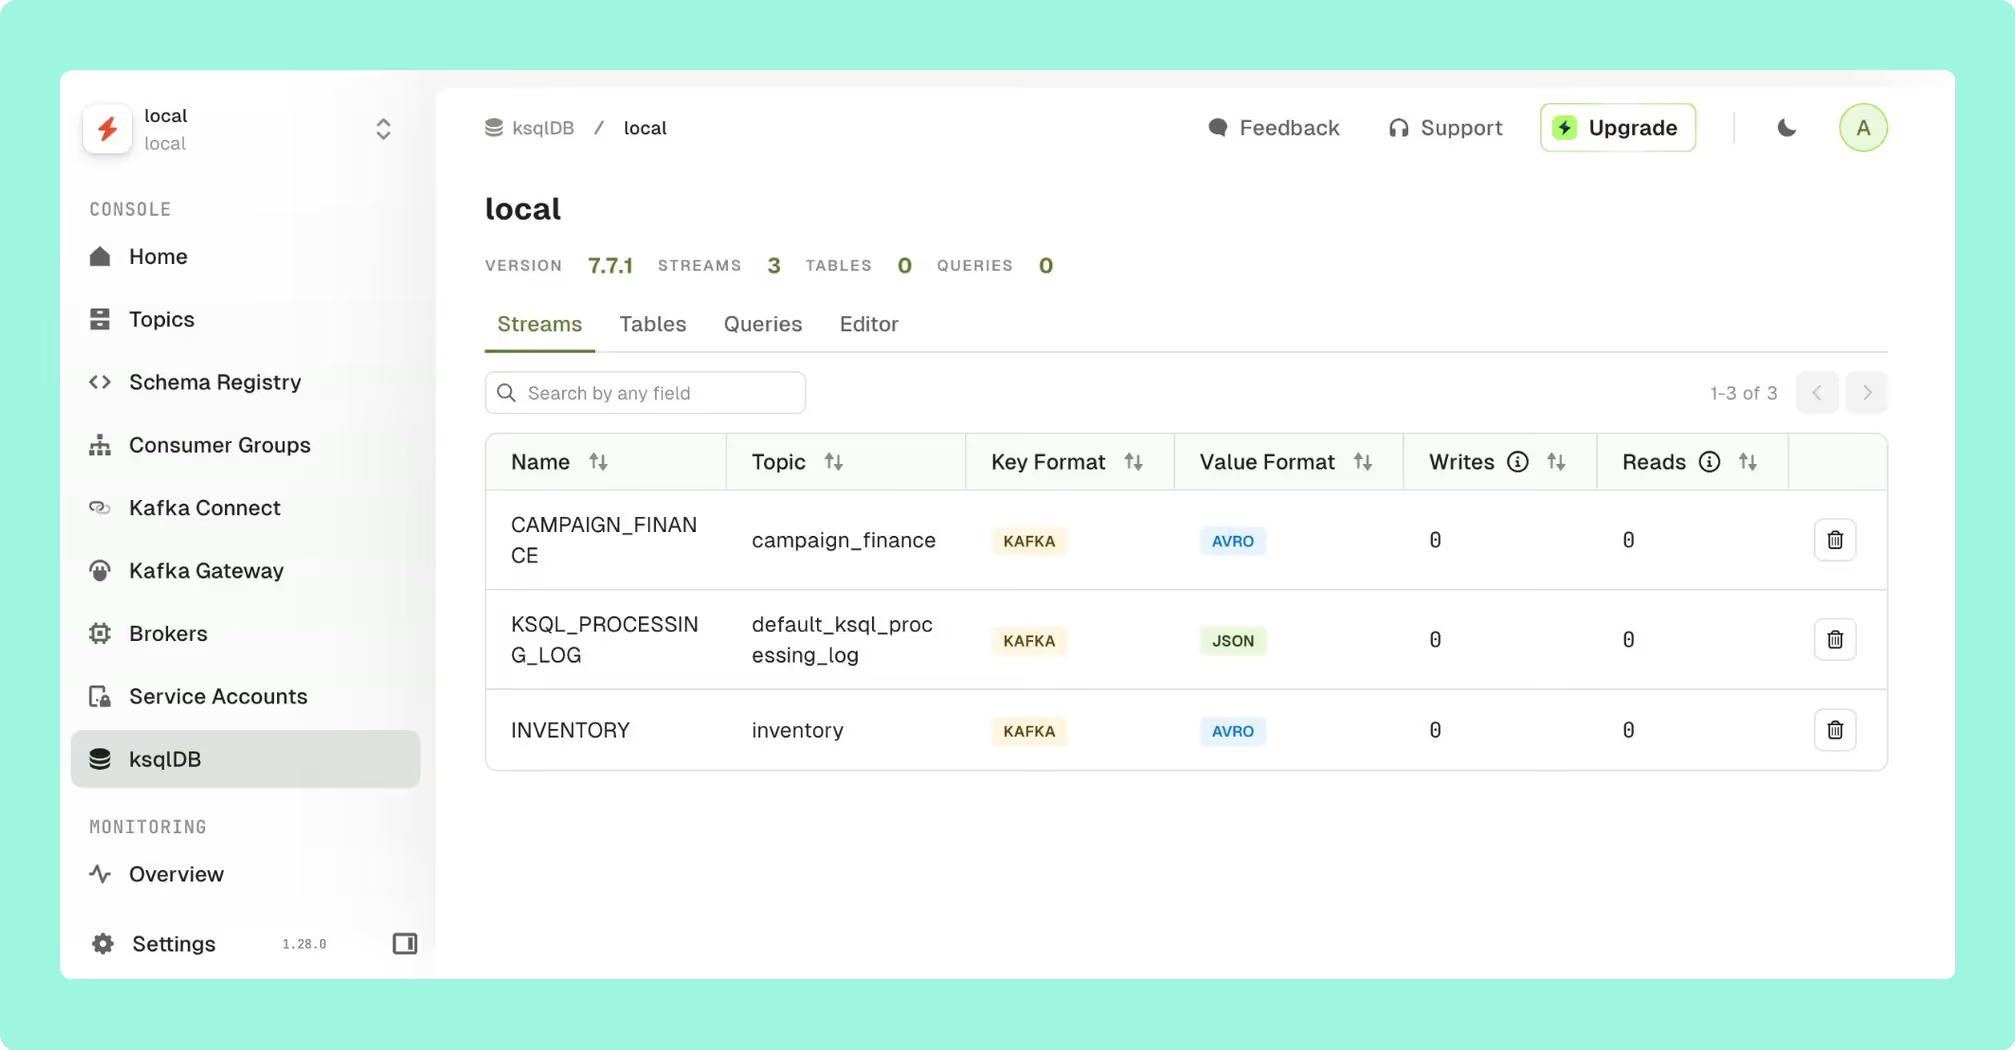
Commercial, with an open-core Community tier. Self-hosted web platform with an optional Gateway proxy for ownership tracking, topic catalogs, self-service workflows. Be aware the proxy can introduce risk due to being in the data path. Best fit for large organisations where multiple teams share infrastructure and need explicit ownership and self-service. Per-seat pricing scales with adoption: published estimates for 100 users across 3 clusters land in the $80,000-$150,000 per year range.
Compare Conduktor vs Kafbat UIConduktor vs LensesConduktor vs Confluent Control CenterConduktor review
Kafka UI in practice: three operational scenarios
The criteria above are easier to evaluate against concrete jobs. The three scenarios below cover the most common ones in platform evaluations.
Debugging consumer lag during an incident
A consumer group has fallen behind. The on-call engineer opens the UI, navigates to the consumer group, and looks at the per-partition lag. One partition is responsible for the bulk of the lag; the others are caught up. The UI shows the partition leader, the consumer instance currently assigned to it, and the timestamp of the last committed offset.
From there, the engineer can inspect the messages near the current offset, look at the message size distribution, and check whether the consumer is failing to process a specific message type. Reviewing the consumer configuration and consumer properties can surface whether the issue is a processing timeout, a deserialisation error, or a throughput mismatch. If the partition has fallen too far behind to catch up within the SLA window, an offset reset to a later position becomes a deliberate decision rather than a panicked one. The UI captures the reset in its audit log, and kafka logs at the broker level can confirm what the consumer actually received.
Managing topics and partitions at scale
DoorDash operates five Kafka clusters managed by a central Real-Time Streaming Platform team. At that footprint, topic governance covers replication factor, partition count, retention policy, compaction settings, and per-topic ACLs. Good partition key selection and message key design matter here too, since the UI makes partition skew visible but the root cause is usually upstream. Message size is another configuration dimension the UI surfaces clearly. Doing this through CLI scripts is workable; doing it through a UI that lets the platform team review every new-topic request, apply a template, and audit the result is faster and less error-prone.
The UI matters most when teams outside the platform team need to inspect or request changes. A self-service workflow that proposes the change, routes it to a platform reviewer, and applies it on approval is the difference between a healthy multi-tenant cluster and one where every team has direct admin access “just to get things done.” For the broader operational discipline around kafka cluster management, cluster best practices, and kafka scaling best practices, those articles cover the decisions that sit behind the UI.
Onboarding teams to a shared cluster
Walmart’s Kafka infrastructure serves over 25,000 consumers across public and private clouds as of June 2024, processing trillions of messages per day. A self-serve UI model is what makes that footprint tractable. New teams use the UI to inspect topics they have read access to, check consumer group health, produce test messages against a staging cluster, and request access to additional topics through a workflow the platform team owns.
The alternative (a central team handling every read request, every consumer-group inspection, and every offset query) does not scale past a few dozen tenant teams. The UI is the lever that moves the work from the platform team to the tenants without giving them broker-admin access.
What’s next for Kafka UI tooling
Three forward-looking themes are worth flagging for anyone making a multi-year decision.
KIP-932 and queues. KIP-932 introduces queue semantics to Kafka through a new “share group” consumer model. Once shipped broadly, this changes the consumer model in ways that will require UI tooling to expose a new kind of entity alongside topics and traditional consumer groups. UIs that don’t adapt will show an incomplete picture of cluster state.
KRaft as the steady state. With ZooKeeper fully removed in Kafka 4.0, the metadata model is simpler and more consistent. UIs that previously read ZooKeeper for cluster state now interact exclusively with the Kafka metadata quorum. This opens the door to richer, faster metadata exposure in tooling, and it eliminates a class of stale-metadata bugs that used to surface in ZooKeeper-era UIs. The kafka architecture article covers the KRaft metadata model in detail.
AI assistants and natural-language operators. Several commercial roadmaps now include some form of natural-language interaction: ask the UI to find consumer groups that have been lagging for more than an hour, or to summarise the recent topic configuration changes across the production topology. Whether this becomes a meaningful operational interface or stays a demo feature is still open, but it is worth tracking. The credible version of this is one where the UI translates a question into an API call against the same metadata it already surfaces, rather than a chatbot that hallucinates broker IDs.
Tiered storage visibility. As more vendors ship tiered storage (Confluent, Aiven, Redpanda, and the upstream KIP-405 work), the UI needs to surface what data lives on the broker, what has been tiered to object storage, and what the cost implications are. This is a relatively new area, and tools differ significantly in how clearly they present it.
Choosing the right Kafka UI
A concise decision framework, summarising the categories above:
- Small team or personal use: Kpow Community Edition, Kafbat UI, or AKHQ. Free, easy to deploy, sufficient for up to three clusters and ten users (Kpow) with light governance needs. CMAK is not an option for new deployments: it depends on ZooKeeper and cannot connect to a Kafka 4.0 cluster.
- GitOps-native preference: AKHQ. Configuration in version control, OIDC out of the box.
- Compliance, audit, or regulated industry: Kpow or Conduktor. Full RBAC, audit logging, and identity-provider integration.
- Data engineering or SQL-style exploration: Lenses.io. SQL Processors and a global catalog suit data engineering workflows.
- Already on Confluent Platform: Confluent Control Center. Suits if you are completely committed to the Confluent stack.
- Enterprise, multi-cluster, multi-tenant: Kpow or Conduktor, with the pricing model as the deciding factor. Per-cluster pricing favours broad adoption; per-seat pricing becomes expensive for larger teams.
“Free” is not the same as “low cost.” Self-hosted open-source tools carry engineering overhead for deployment, version upgrades, security patching, and on-call. For a single-cluster team, that overhead is trivial. For a platform team running a regulated topology across multiple regions, the all-in cost of an open-source tool often exceeds the licence cost of a commercial one.
Conclusion
The right Kafka UI reduces operational overhead, makes security enforceable across teams, and gives operators, developers, and data engineers a meaningful window into cluster behaviour. The wrong choice, or no choice at all, is a form of operational debt that compounds as the cluster grows: every offset reset done by hand, every ACL change applied via CLI, and every consumer-group lag investigation that takes an hour instead of five minutes adds up. The UI is the operational layer that sits above architecture, monitoring, and security, and the right one is the one that fits your team’s scale, governance needs, and pricing tolerance.
Factor House built Kpow for platform and SRE teams running Kafka in regulated, multi-cluster environments. If your evaluation maps to that profile, you can try Kpow Enterprise for free against any Kafka cluster, deployed via Docker, Helm, or JAR.
FAQ
What is a Kafka UI?
A Kafka UI is a web-based interface for managing and inspecting an Apache Kafka cluster. It exposes topics, partitions, consumer groups, brokers, schemas, and connectors through a browser, removing the need to use the Kafka CLI for routine operational tasks.
What is the difference between a Kafka UI and a Kafka monitoring tool?
A Kafka UI is for real-time operational interaction: inspecting cluster state, reading messages, and performing actions like offset resets or connector restarts. A Kafka monitoring tool such as Prometheus and Grafana or Datadog is for time-series storage, alerting, SLO tracking, and historical trend analysis. Most production topologies use both.
Which Kafka UI tools are free and open source?
The widely-used open-source options are Kafbat UI (Apache 2.0), AKHQ (Apache 2.0), and Redpanda Console (BSL community edition, with enterprise features behind a paid licence). Each is self-hosted and free to download. While not open source, Kpow Community Edition is also a viable option.
Is Confluent Control Center free to use?
No. Confluent Control Center is bundled with Confluent Platform Enterprise and is not available as a standalone free product. Pricing is included in the broader Confluent Platform licence, which typically ranges from around $50,000 to $500,000+ per year depending on cluster footprint and support tier.
How do I manage consumer group offsets from a Kafka UI?
Most Kafka UIs let you view the current offset and log-end offset for each partition in a consumer group, and reset the offset to the earliest, latest, a specific timestamp, or a specific offset value. The action is typically gated by an RBAC permission and recorded in an audit log. The exact workflow varies by tool but the underlying API is the standard Kafka admin client.
Product demo · 6 min
Apache Kafka consumer group monitoring & lag: Kpow demo
Chad Harris walks through consumer group monitoring in Kpow: tracking group stability over time, breaking lag down to the partition level, safely resetting or skipping offsets on a running group, and using group topology to trace lag back to a host or topic.
Can a Kafka UI manage Kafka Connect connectors?
Yes, most Kafka UIs integrate with Kafka Connect to list connectors, surface task status, and provide pause, resume, and restart controls. Configuration can usually be inspected and edited from the UI. Redpanda Console includes Connect management in its free community edition, and one deployment can reach several Kafka Connect clusters.
How do I secure a Kafka UI in a production environment?
Authenticate users through your identity provider (SAML, OIDC, or LDAP) rather than local users. Enforce RBAC at the topic, consumer-group, and connector level. Bind the UI to an internal network behind your existing identity proxy. Enable audit logging and ship the audit log to a SIEM. Ensure the UI uses a service account with the minimum broker permissions it actually needs.
Which Kafka UI tools support RBAC and SSO?
Full RBAC with SSO is offered by Kpow, Conduktor, Lenses.io, and Confluent Control Center. AKHQ supports SSO and basic RBAC since version 0.25. Kafbat UI configures roles per resource type in YAML and supports six identity provider types. Kadeck offers RBAC with LDAP and OpenID Connect on its Enterprise tier. Redpanda Console requires the enterprise licence for SSO and RBAC.
Product demo · 1 min
Apache Kafka access policies & SSO: Kpow demo
Chad Harris covers access policy configuration in Kpow: exactly which permissions are assigned to the role currently logged in, and how SSO integration with OAuth, SAML, Entra ID, and other providers drives permission assignment from your existing identity roles and groups.
What is the best Kafka UI for a small team versus an enterprise deployment?
For a small team running up to three clusters, Kpow Community Edition usually covers the operational needs at zero licence cost, as do open-source tools such as Kafbat UI or AKHQ for larger cluster counts. For an enterprise deployment with multiple clusters, regulated workloads, and many tenant teams, a commercial tool with full RBAC, audit logging, and vendor support (Kpow, Conduktor, Lenses.io, or Confluent Control Center) tends to be a better fit.
Can a Kafka UI manage multiple clusters from one interface?
Yes. Kpow, Conduktor, Lenses.io, AKHQ, Kafbat UI, and Confluent Control Center all support multi-cluster management from a single instance. Cluster switching, unified search, and environment-aware RBAC vary in maturity, and Redpanda Console manages one broker cluster per deployment on any licence.
Does Kafka UI work with KRaft mode (Kafka 4.x)?
The actively maintained Kafka UIs (Kpow, Kafbat UI, AKHQ, Conduktor, Lenses.io, Redpanda Console, Confluent Control Center) all support KRaft mode. With Kafka 4.0 having fully removed ZooKeeper as of March 2025, KRaft is the only supported metadata mode going forward, and any UI that still depends on ZooKeeper APIs has a gap to close.
What is the difference between Kafka UI and Kafbat UI?
“Kafka UI” was the original project name for an open-source Kafka management interface formerly maintained on GitHub by Provectus. The project was forked and is now actively maintained as Kafbat UI by the same core community of maintainers. If you see references to “kafka-ui” in older documentation, they almost always refer to what is now Kafbat UI.
How does a Kafka UI handle schema registry and Avro or Protobuf messages?
A Kafka UI with Schema Registry integration resolves the schema for a message by reading the schema ID from the message header, fetching the schema definition from the registry, and using it to deserialise the payload into a human-readable form. Avro, Protobuf, and JSON Schema are supported by the major tools. The UI typically also exposes subject management, version history, and compatibility-rule inspection.
For the rest of the tooling landscape, see the complete guide to Kafka.
How these tools were scored
Every option is scored from 0 to 10 on each criterion, from the evidence and sources this page cites, and the reason for each score is on its card. The criteria are weighted: Cost as teams grow counts once, Deployment footprint counts once, Support and maintenance counts three times, Access control and audit counts three times and Multi-cluster reach counts once, for a total out of 90. Access control and audit and Support and maintenance count three times here, because in a regulated environment the decisive questions are who may act on a cluster and who is accountable when a dependency advisory lands. Cost as teams grow, deployment footprint and multi-cluster reach are real, but they are one-off decisions rather than standing exposure, so they count once. This page is published by Factor House, which makes Kpow. Every option is scored on the same rubric and the same sources: Kpow's per-criterion scores are set the same way as every other option's and are not adjusted, and the weights apply to every option alike. Kpow ranks first on its total of 82 out of 90. The other options follow by total. Conduktor is listed last whatever its total; on its total of 74 it would place second.